Let’s talk a little bit about what is present on the online community management benchmark dashboard for now.
Where everything starts: “Alive” users
When we want to quickly understand whether a person is healthy, we take their temperature. Now the question: What measurement should we take to sense if a community is healthy? Almost every community manager has faced the task of determining the health of a community. When I was growing Stack Overflow in Russian, the number of questions asked per day on the site was one of my primary proxy metrics to represent the community’s health. If the number was growing, then everything was fine. Later, while designing health metrics for all Stack Exchange sites, I re-defined community health to make it more abstract and based on the community, rather than posts. I defined the health of a community as the difference between the number of users who started participating on a site in a given period of time and the number of users that have left the community. If the difference was positive, everything was fine with the community (we will discuss the reasons for that in a separate post). As it turned out later, when one is able to calculate this metric, they can measure a bunch of other things. So let’s talk about the idea in detail.
Counting the number of people who started their participation on a site is not difficult. The problem arises when you try to determine who has left the community. To understand why, let’s look at some charts with user activities.
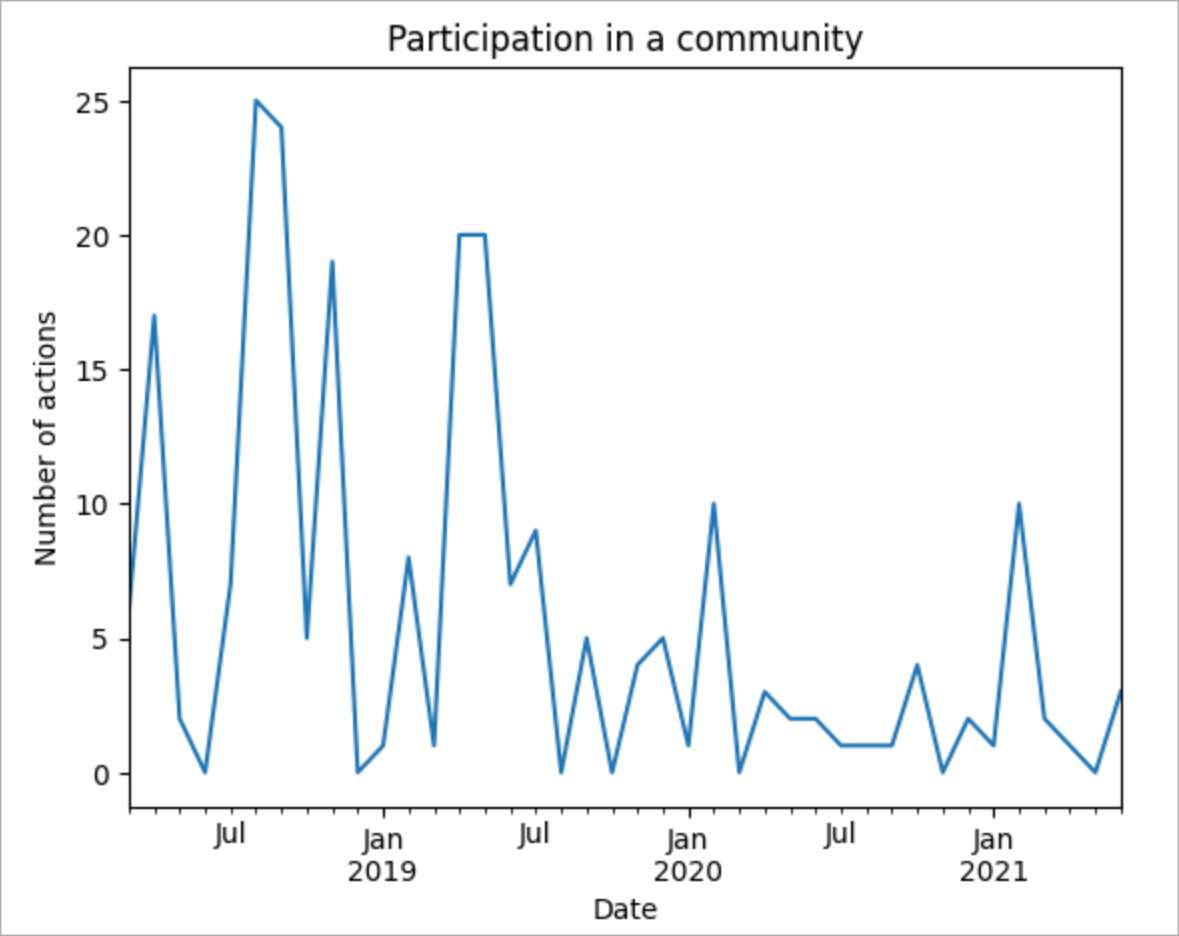
Here is a user “A”, who has published 229 posts from 2018 till mid-2021. Most likely they have churned.
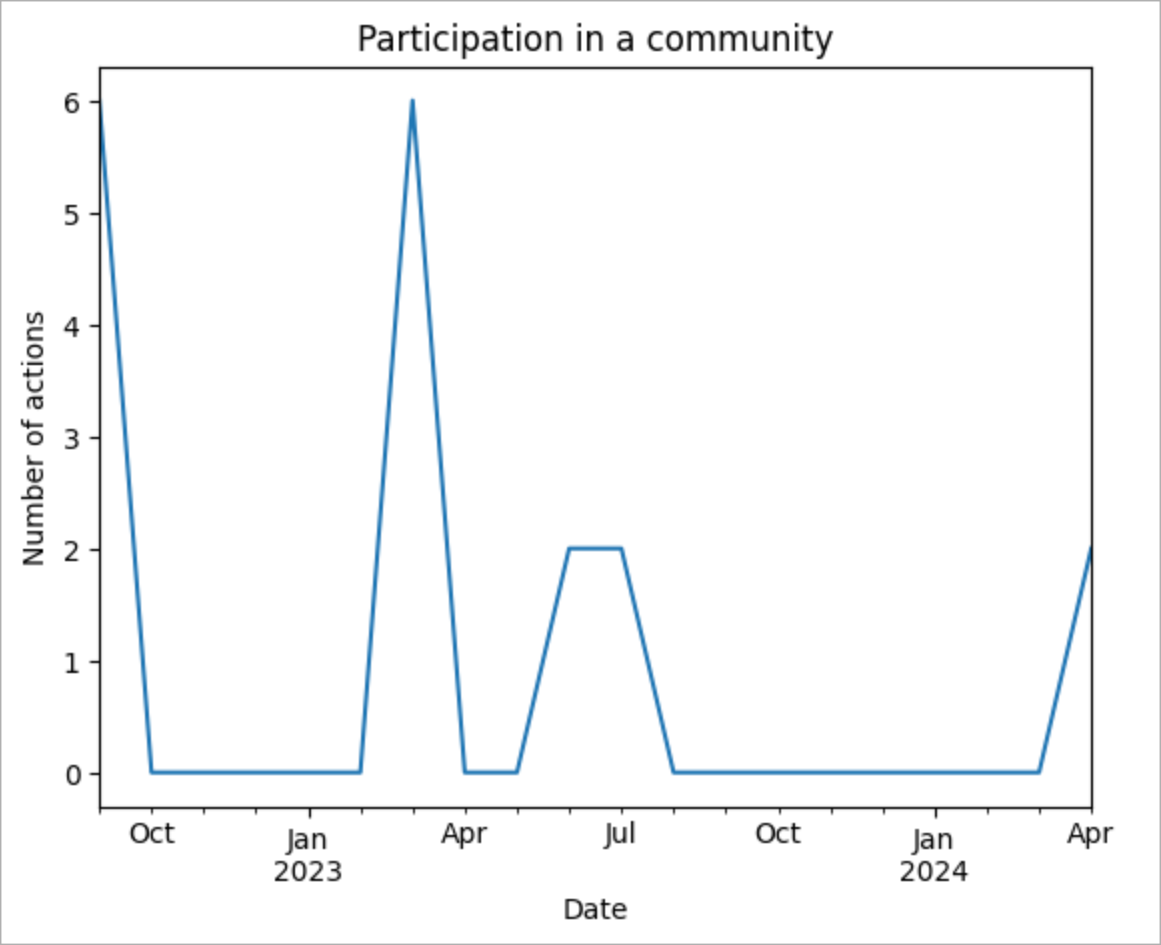
Here is a user “B”, who has published 18 posts occasionally from the end of 2022 till mid-2024. Most probably they are still within the community.
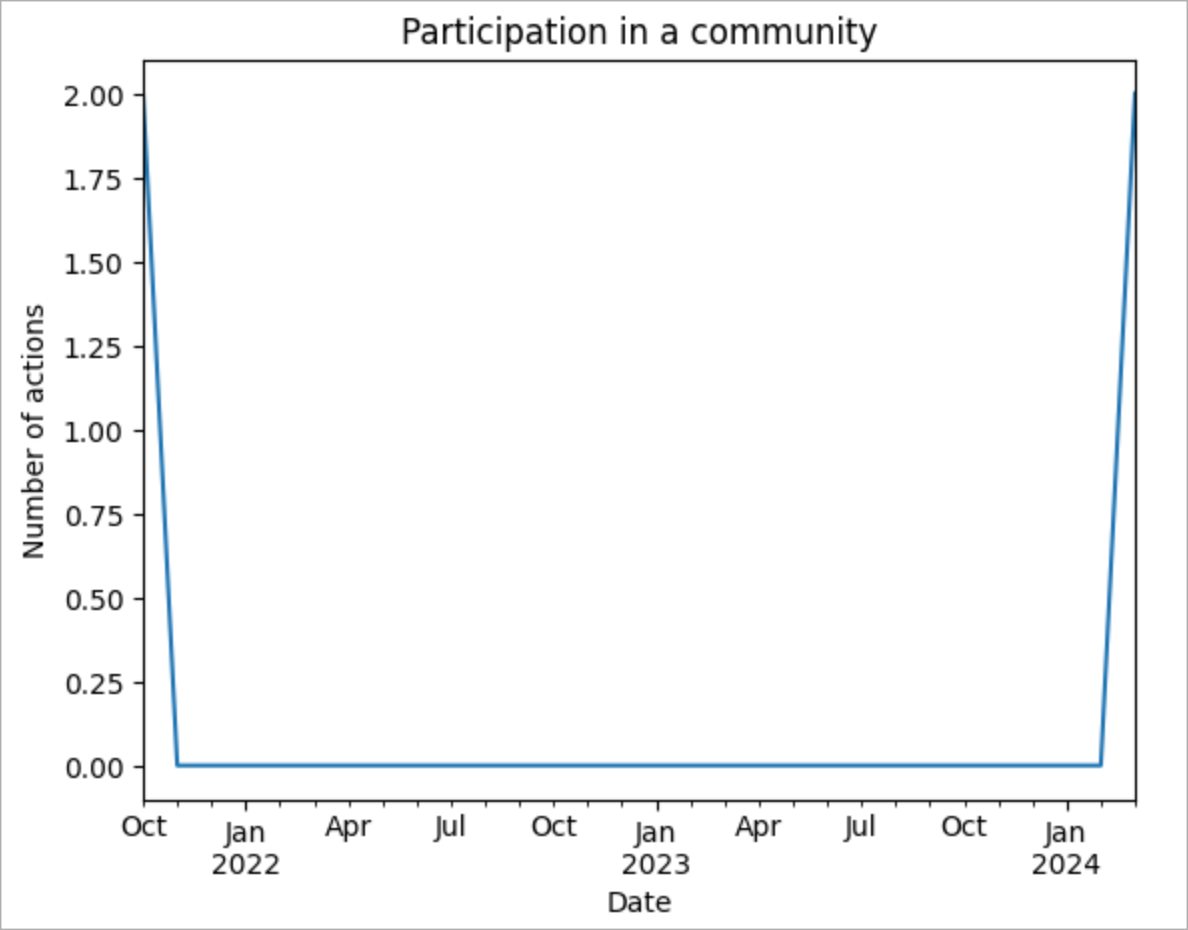
Here is another user “C”, who has published 4 posts, two in Oct 2021 and the other two in March 2024. They are likely ‘alive’ too.
There are a lot of different user activity patterns and any heuristic to determine if a user is still ‘alive’ produces a large error. At least, I personally have not found any simple way to accurately guess if a user is going to post on a site again.
At the same time, this problem has already been solved in the retail industry. In retail, it is critical to track and predict the number of purchases made and the size of each purchase. One of the metrics that helps you figure this out is customer lifetime value (or CLV for short). CLV shows how much value a customer brings to a company during the time they are a customer. Thus, CLV can be broken down into two components:
- The number of purchases made by a client.
- The average size of a purchase.
In fact, we are only interested in the answer to the first question. If we know how to estimate the number of posts (or any other activities) a user is going to publish on a site, we are able to say whether they are still part of the community at a particular moment of time.
Since each user has their own participation pattern, the only correct approach to create an estimate is to build a probabilistic model for each user individually. One of the popular models used for that task is Buy Till You Die. Having such a model, one can calculate the probability that a specific user, having a specific behavior pattern on your site, is going to create a post today, tomorrow or in N days from now.
Note: Speaking on a very low level, for the online community industry benchmarks I use one of the implementations of the BG/NBD model to calculate the probability that a user will be active in the future.
Note 2: At the output of the model we get probabilities ranging from 0 to 1. At the same time we need to get a binary answer if a user is still alive or has churned. To do this, one needs to use some threshold value. If the resulting probability of participation for a user is below the threshold, we consider the user to be churned. At the time of writing this article, I use a threshold of 0.5 to calculate the benchmarks.
By calculating the probabilities of users participating “tomorrow”, we will obtain estimates of the number of users who are “alive” today.
Churned users
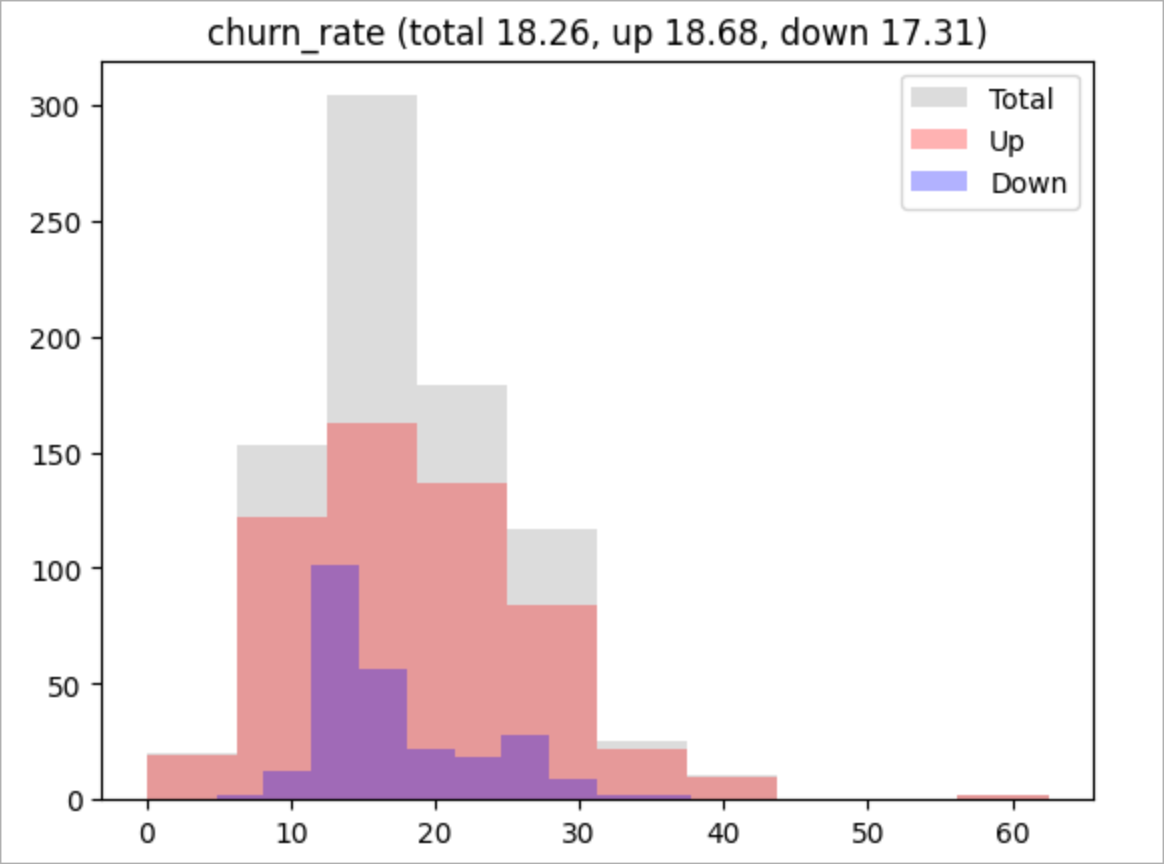
Once we know how to determine which users are alive and who have left the community, there is nothing that stops us from calculating all other metrics. First, we can calculate the outflow of users as the percentage of those who left the community on a given day among alive users. The mathematics here is extremely simple.
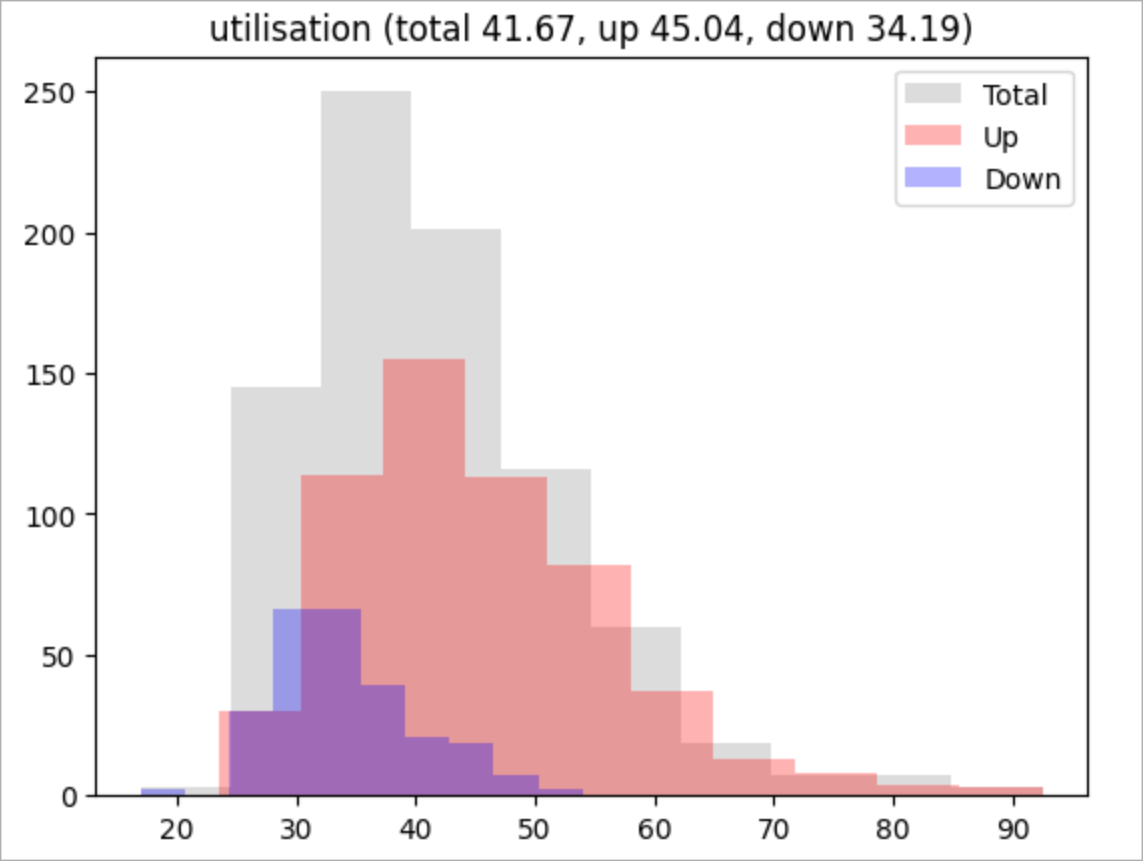
Utilization
Throughout the post we have been talking about “alive” users, but we all got used to operating with MAU or DAU. Counting “alive” users is much more difficult than calculating active users because one needs some kind of a model with which can mark users alive or churned, while active users are visible (everyone who performed a given activity). But once you know how to determine if a user is alive, you can answer a lot of interesting questions. For example, how effectively you use the talents of your users while they are part of the community, or in other words, the percentage of active users out of the number of alive users. I call this metric “Utilisation”.
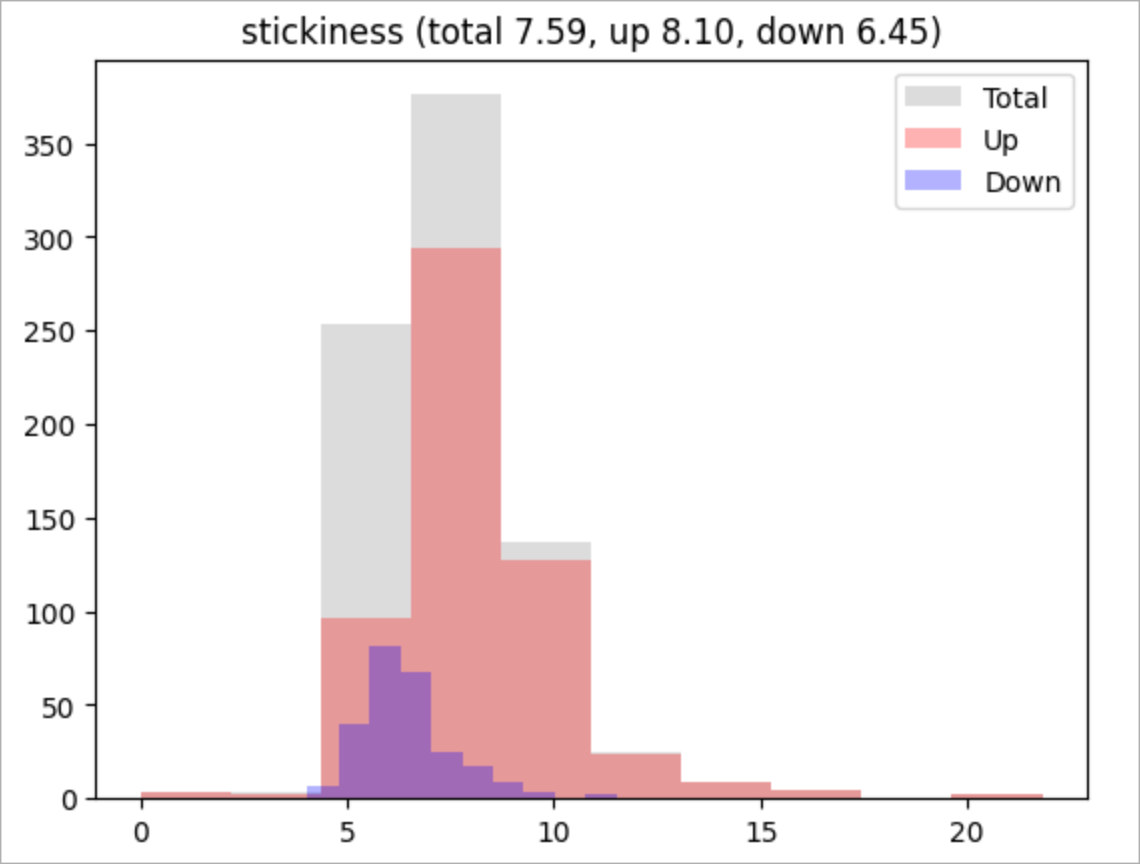
Stickiness
The last metric I would like to talk about is Stickiness. Its essence is to determine what percentage of users are active on a given day out of the number of active users over the last month. Not to be confused with the 30-day retention rate! Stickiness is a completely different metric and simply shows the ratio of DAU to MAU.
P.S. I also have a very useful book on how to grow online communities!
P.S.S. Need help with measuring, researching, or predicting performance of an online community? Please write me an email! I will be glad to help =)