As we all know, a healthy online community is a community that has more people starting participating in it than leaving it. In online communities all kinds of participation depend on… well, new questions. If there are no new threads there could not be any replies, votes, likes, comments, etc. As a result, a lot of community management, especially at the early days, comes to working with people who ask questions. Let’s look at a few metrics that help us effectively track our progress in this direction.
What percentage of users begin their community participation by asking?
First things first. We need to know how people begin their participation in the community. Usually, there are only two options: starting a new discussion or posting a reply in an existing one.
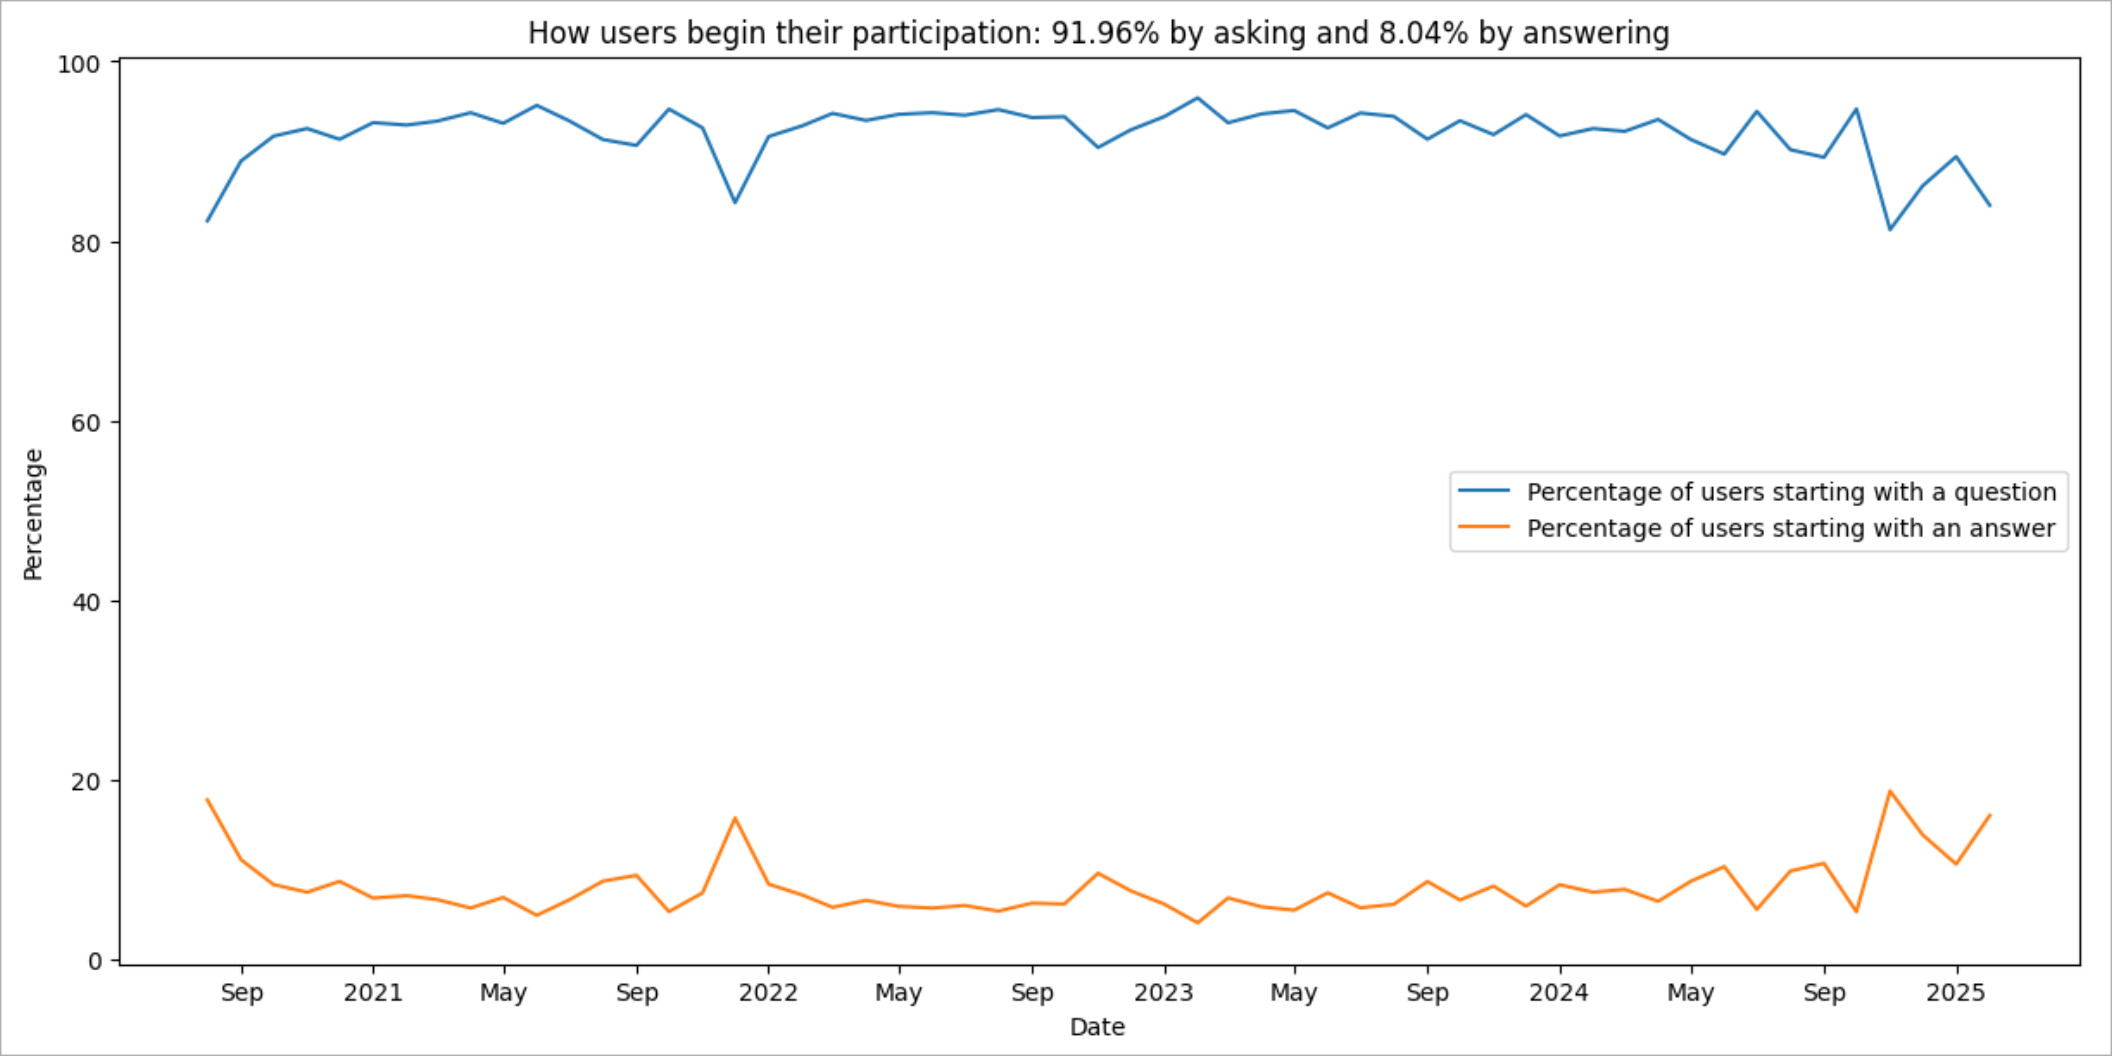
In general, it is not that important if you have a high or low percentage of people who start by asking in your community. At the same time, the higher this percentage, the more important it is for you to track all the metrics we are talking about in this post.
How many questions should a user ask to adapt into the community?
A long time ago, when I was working as a Data Analyst at Stack Overflow, I needed to measure what influenced users who ask questions to continue asking in the community (note: mathematically this can be done with logistic regression). No matter what parameters I added to the model, the most significant factor was the presence of an answer, and not necessarily a correct one.
Indeed, imagine that you asked a question in a community, but all you got in response was just silence. No reaction at all! Approximately at the same time, you asked the same question in another community where users tried to help you and gave some recommendations. Question to you: In which community will you ask your questions next time?
Great! We know that having an answer affects the likelihood of a user continuing to ask questions in the community. How can we determine if this changes over the lifetime of the user? Easy! We can break down all users by the sequential number of their questions in the community and see how the factor of each group changes. This will be our next metric that I call an adaptation coefficient.
Adaptation coefficient - tells how quickly a user begins to trust your community so much that they are ready to try asking a question again, even if they did not receive an answer to the previous one. The lower the value of the adaptation coefficient, the better.
Note: It is important to note that some communities have a zero adoption rate, meaning that a user will leave or continue to participate in the community regardless of whether they receive a reply from the very beginning of their participation. In my view, this is not okay. In the near future, I will study the parameters of such communities, but for now I am removing zero adoption rate communities from my data set when I calculate the final benchmark for the metric.
Now, let’s see what the industry adoption rate looks in one of our communities.
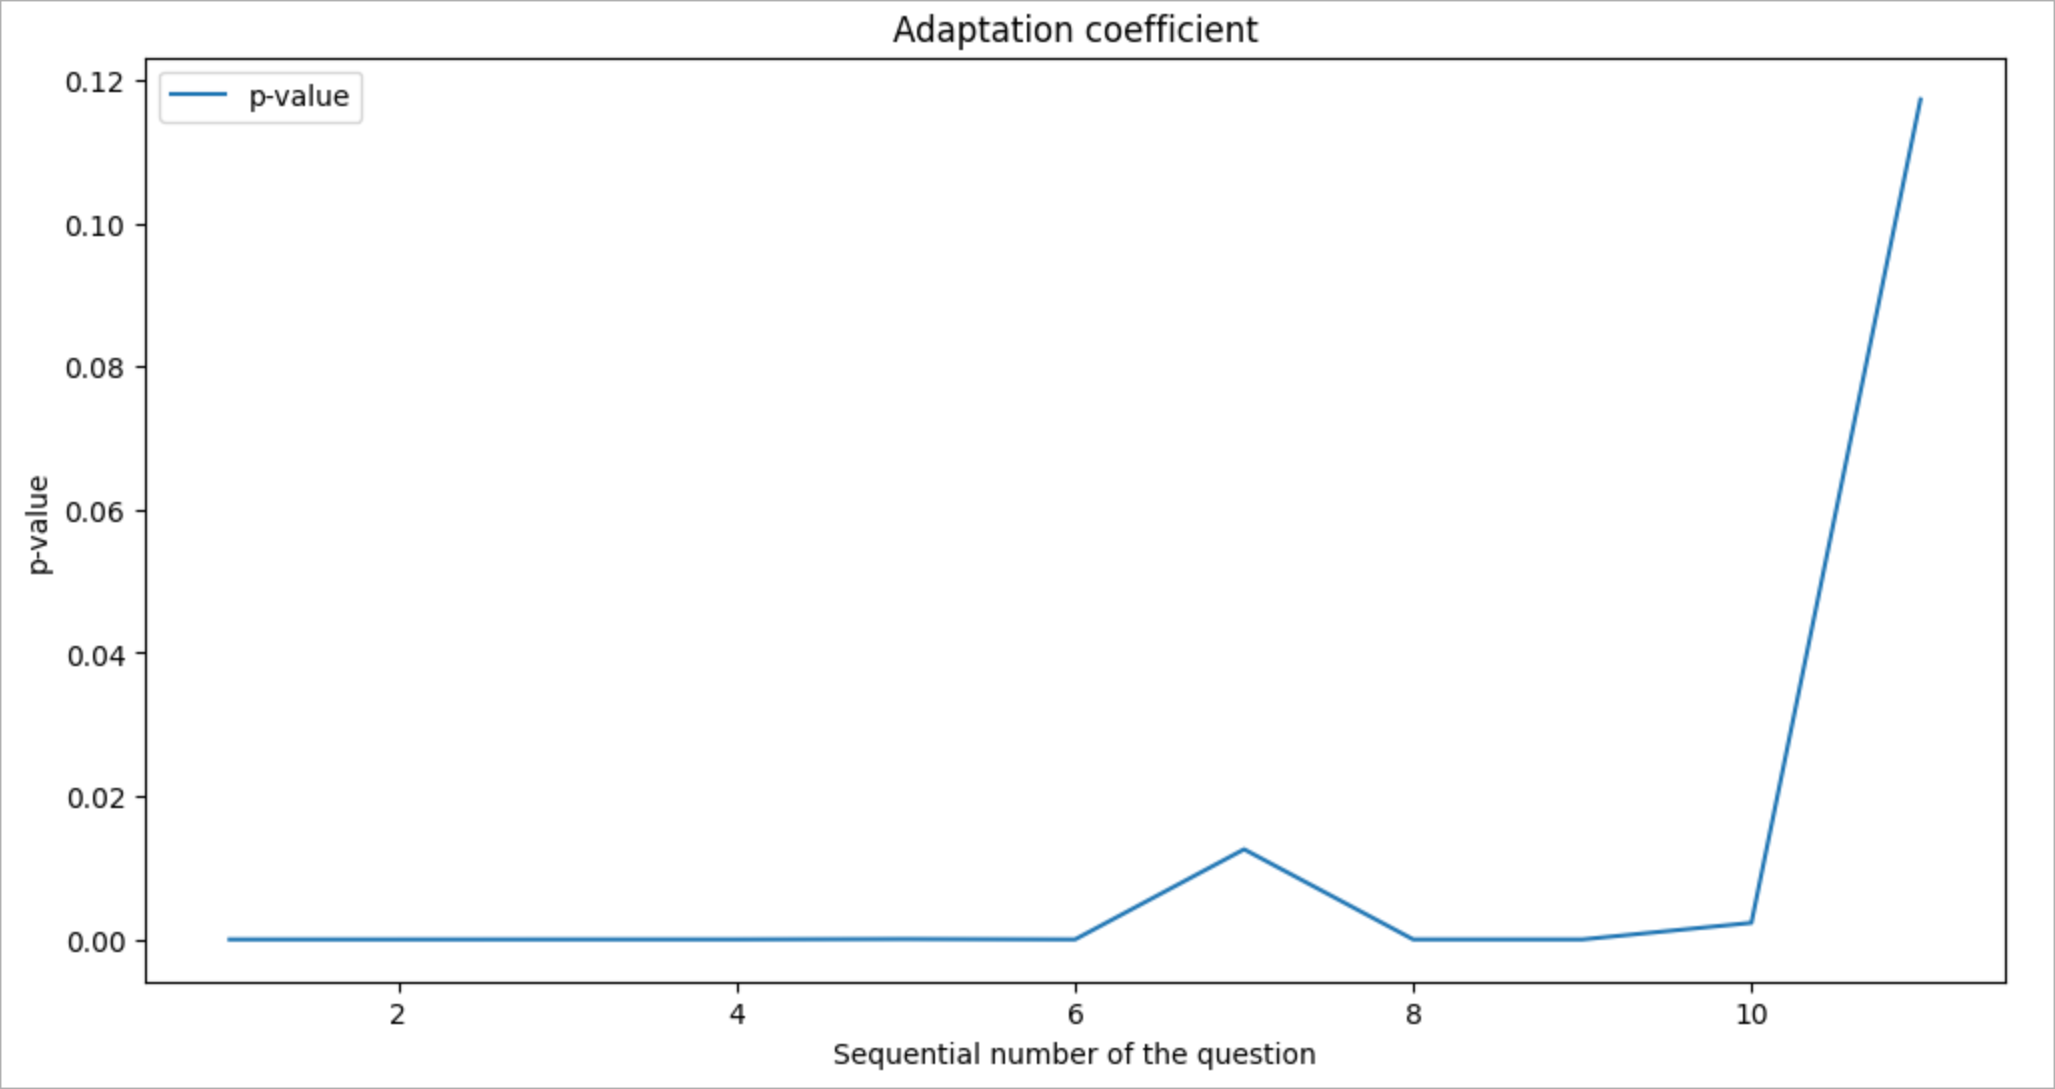
What does this mean? It means that if the owner of that community wants more users to stay in the community, they need to make sure that all newcomers get an answer up to their 11th question on the site.
The metric in the benchmark app
How much do new users believe in the benefits of our community?
Now let’s try to estimate how much your community is trusted by people who have never participated in it before. It is not that easy, yes, but I suggest a heuristic. I think that if a user asks a question, does not get an answer, and then asks in the community again, most likely, they initially came to your community intentionally. At least, we have some reasons to believe that they act consciously. The higher this number, the better.
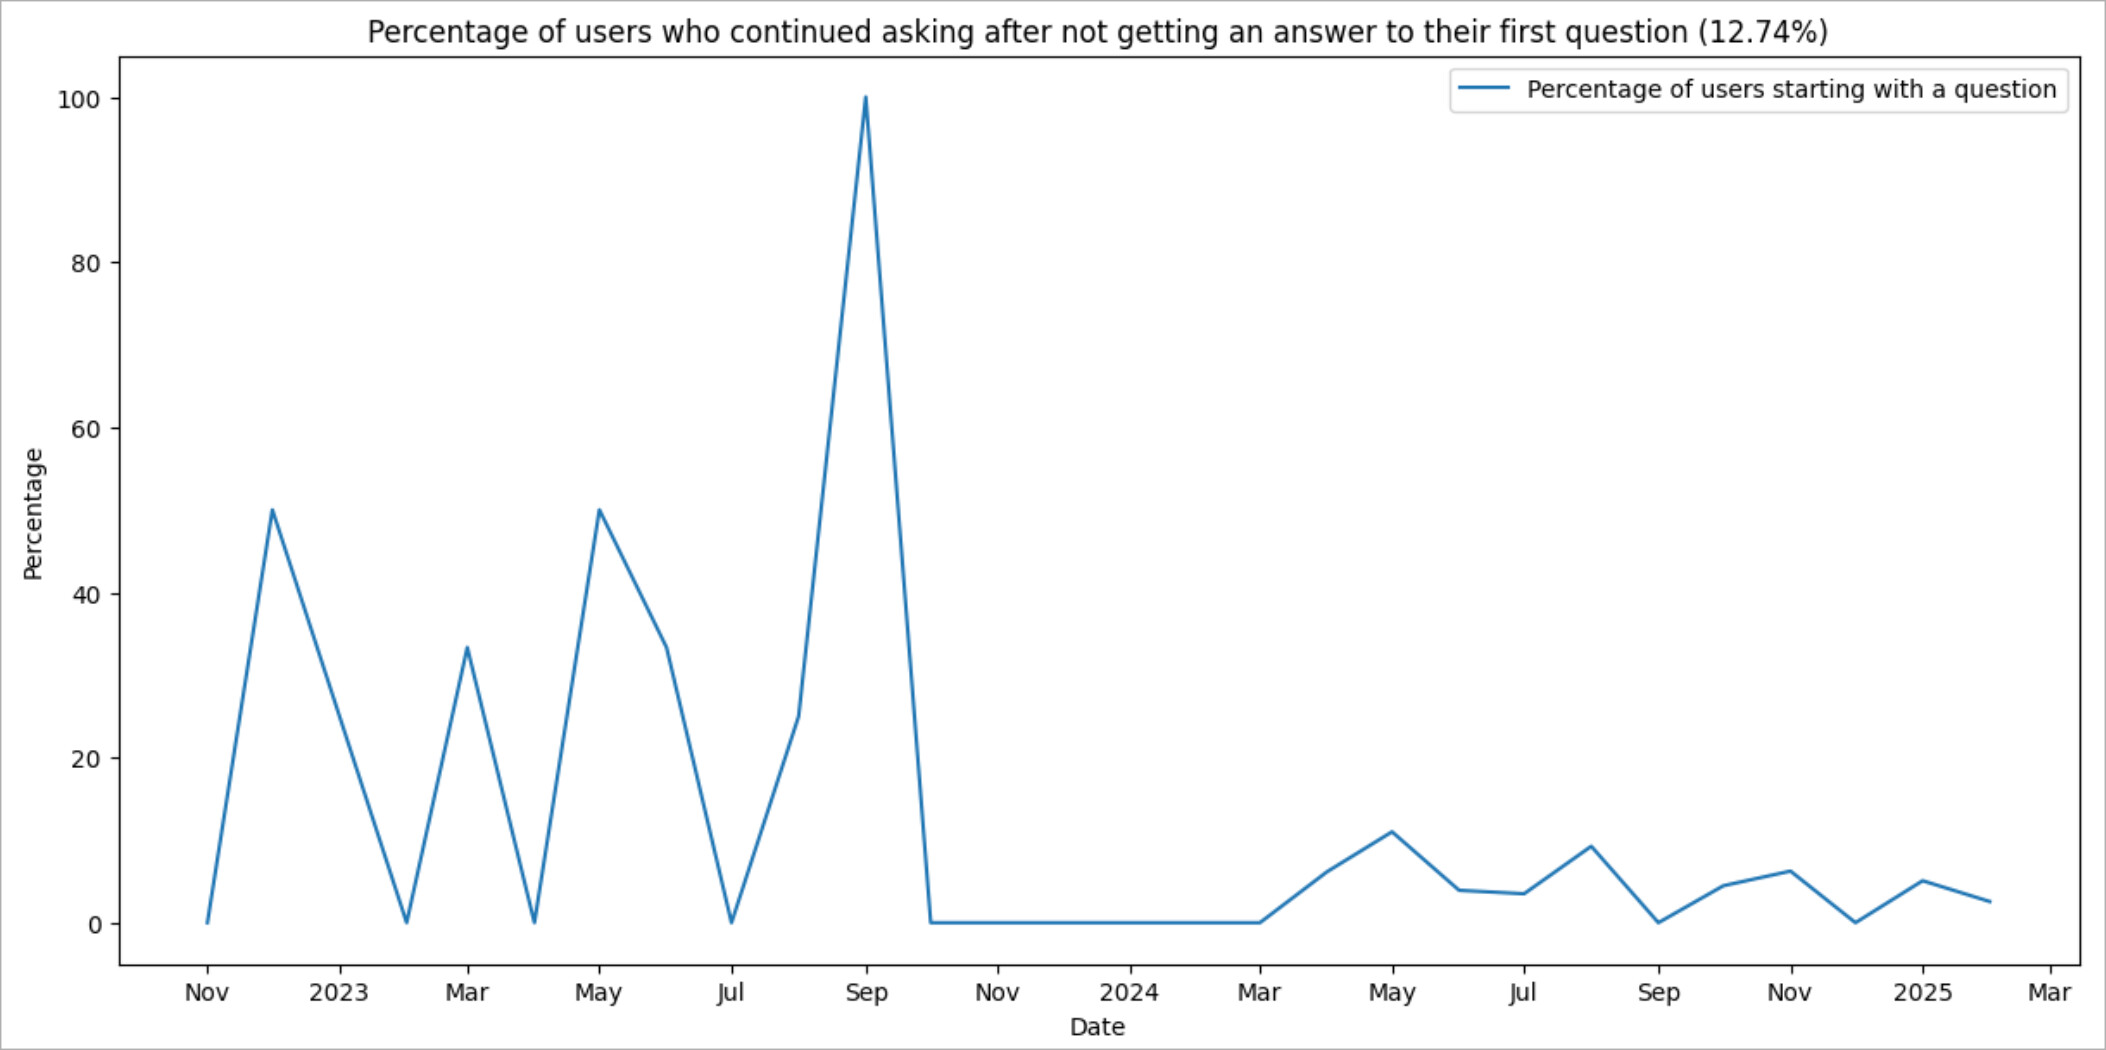
This is an important metric but it is a relative one. Which means it is difficult to interpret it on its own and it makes most sense to look at it in the context of the industry average.
The metric in the benchmark app
Among those who start by asking, how many questions one asks before starting answering others’ questions?
People who start participating with a question usually come to the community with some problem, having solved which their initial motivation to participate ends. The task of the community manager is to make sure that while waiting for an answer, the user becomes interested in starting to help others. This is exactly what we measure here. In other words, this metric shows how many questions a user asks before they start answering to other’s questions.
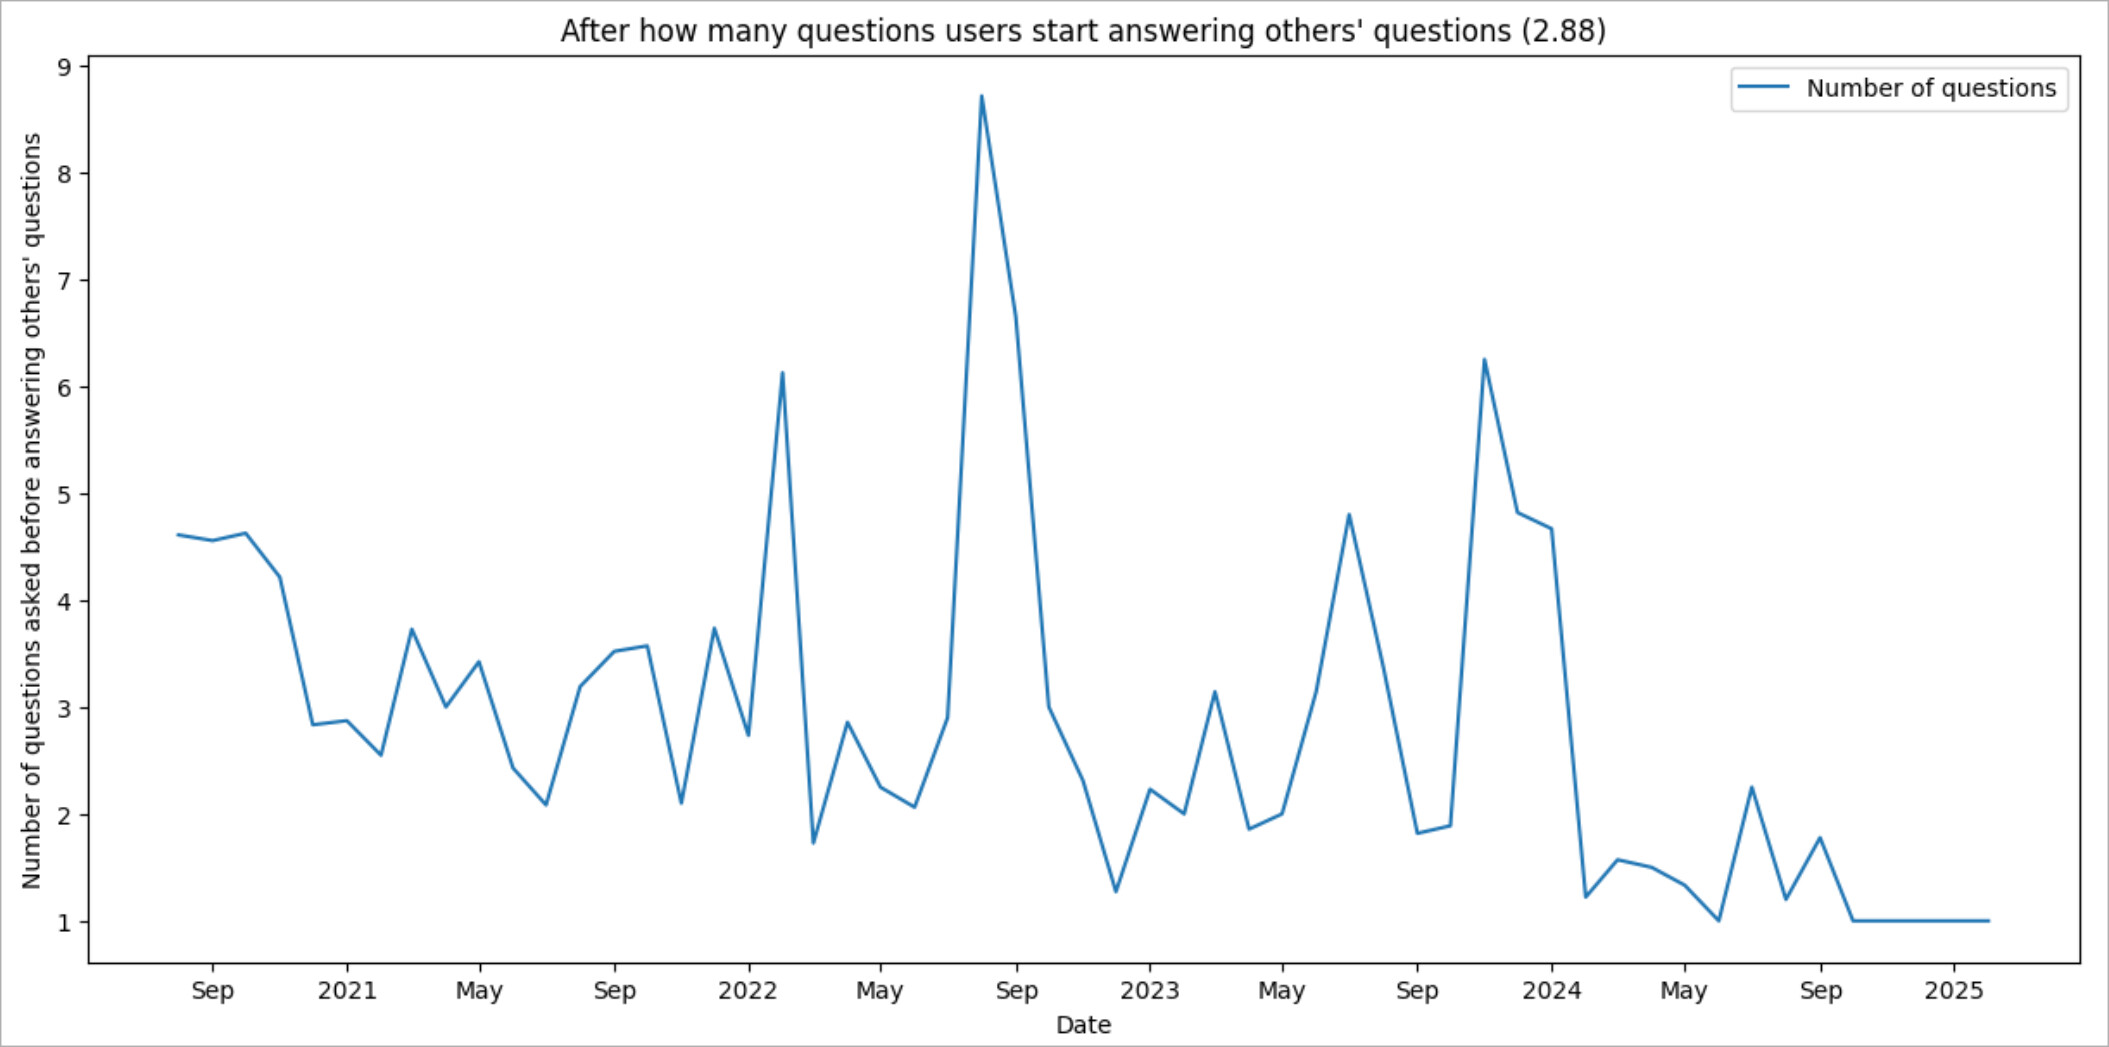
The interpretation is simple: The lower the value of this metric, the more welcoming and engaging the atmosphere in your community is.
The metric in the benchmark app
What is the percentage of users who ask their first / second / third / etc. question in the community?
When it comes to tracking the engagement of askers, the best way to do it is to track the percentage of each user group, grouped by the sequential number of their question, among all active askers.
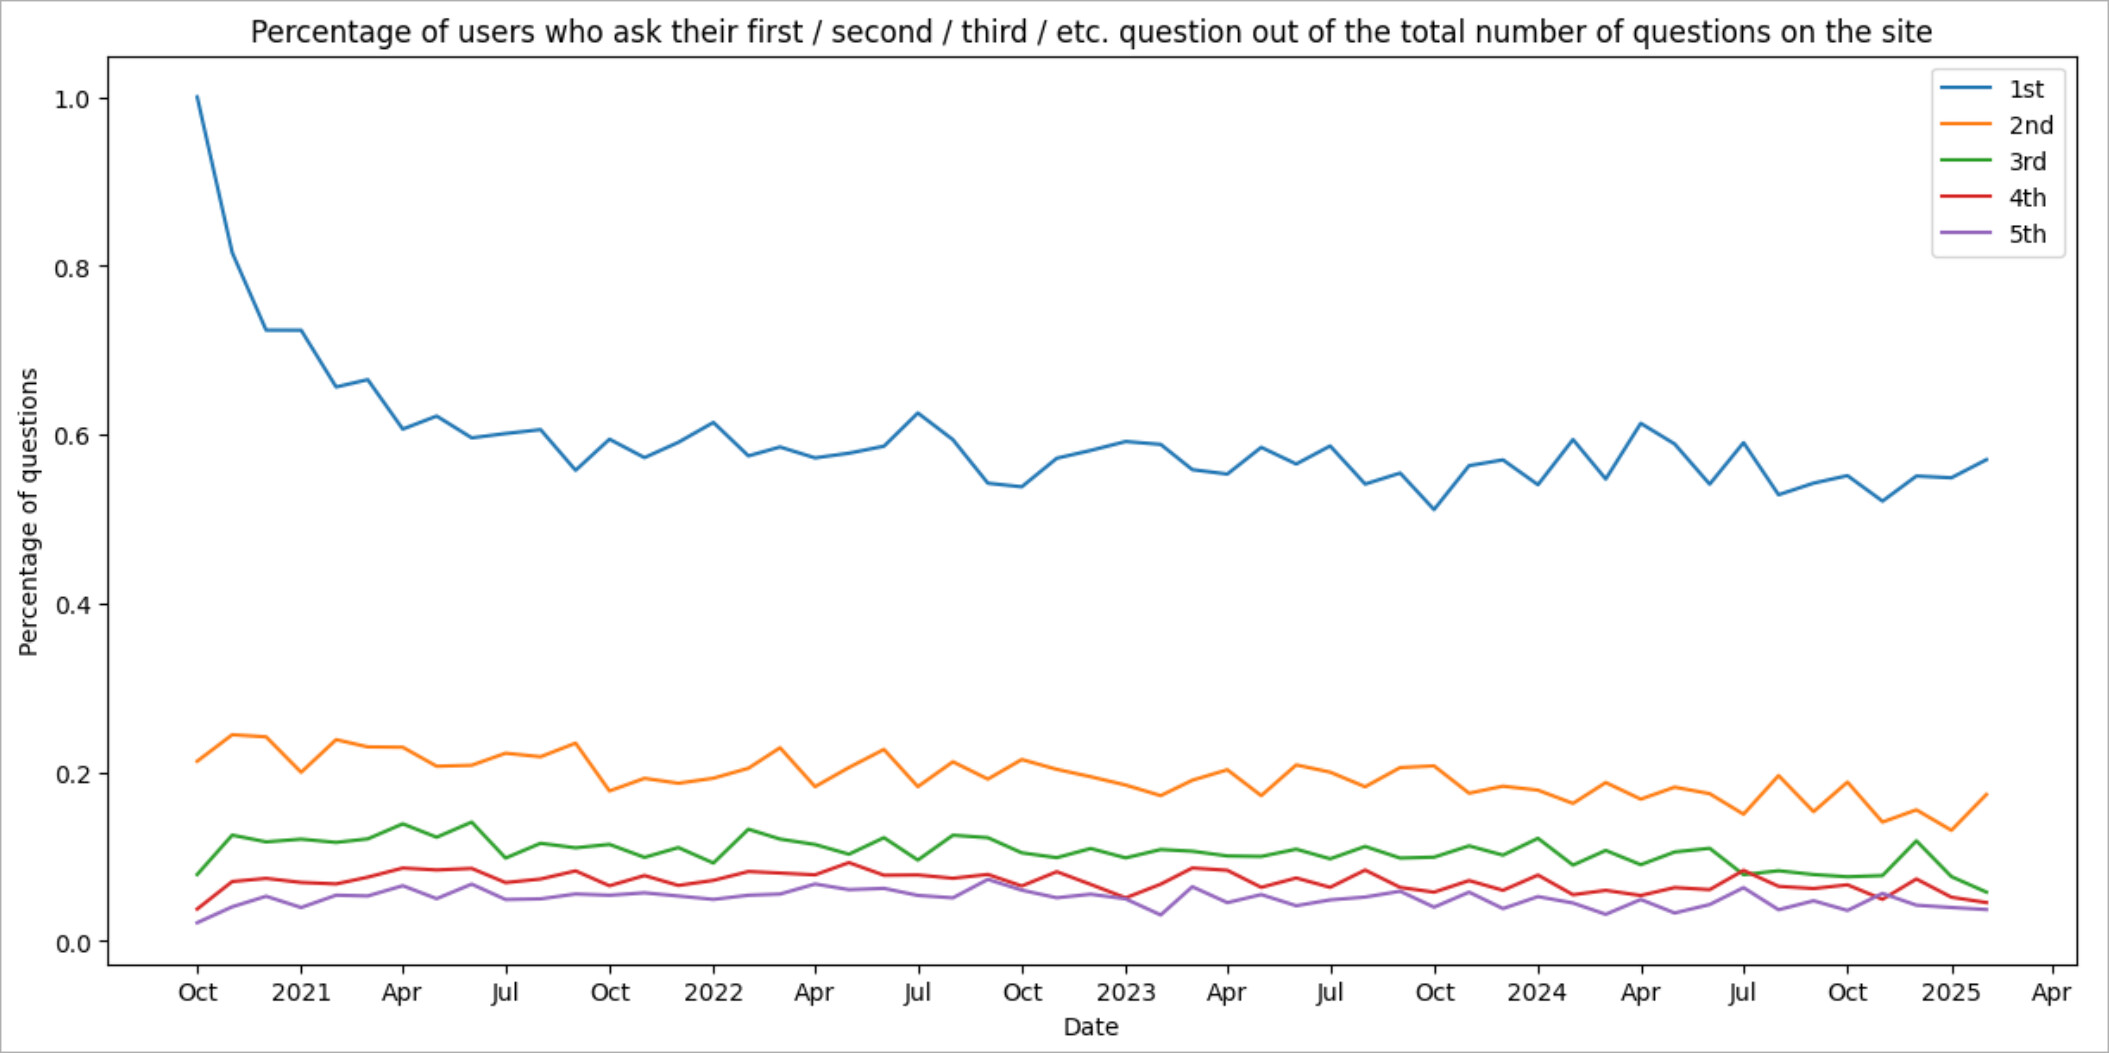
Tracking the percentage helps us see if there are any issues in the engagement of a particular user group. In the case of a particular community, it may sometimes make sense to also look at the absolute number of questions asked by that user group.
The metric in the benchmark app
As an alternative to the percentage of users with some number of questions asked, we can look at *the percentage of users asked their first / second / third / etc. question relative to those who asked their second / third/ fourth / etc. question.
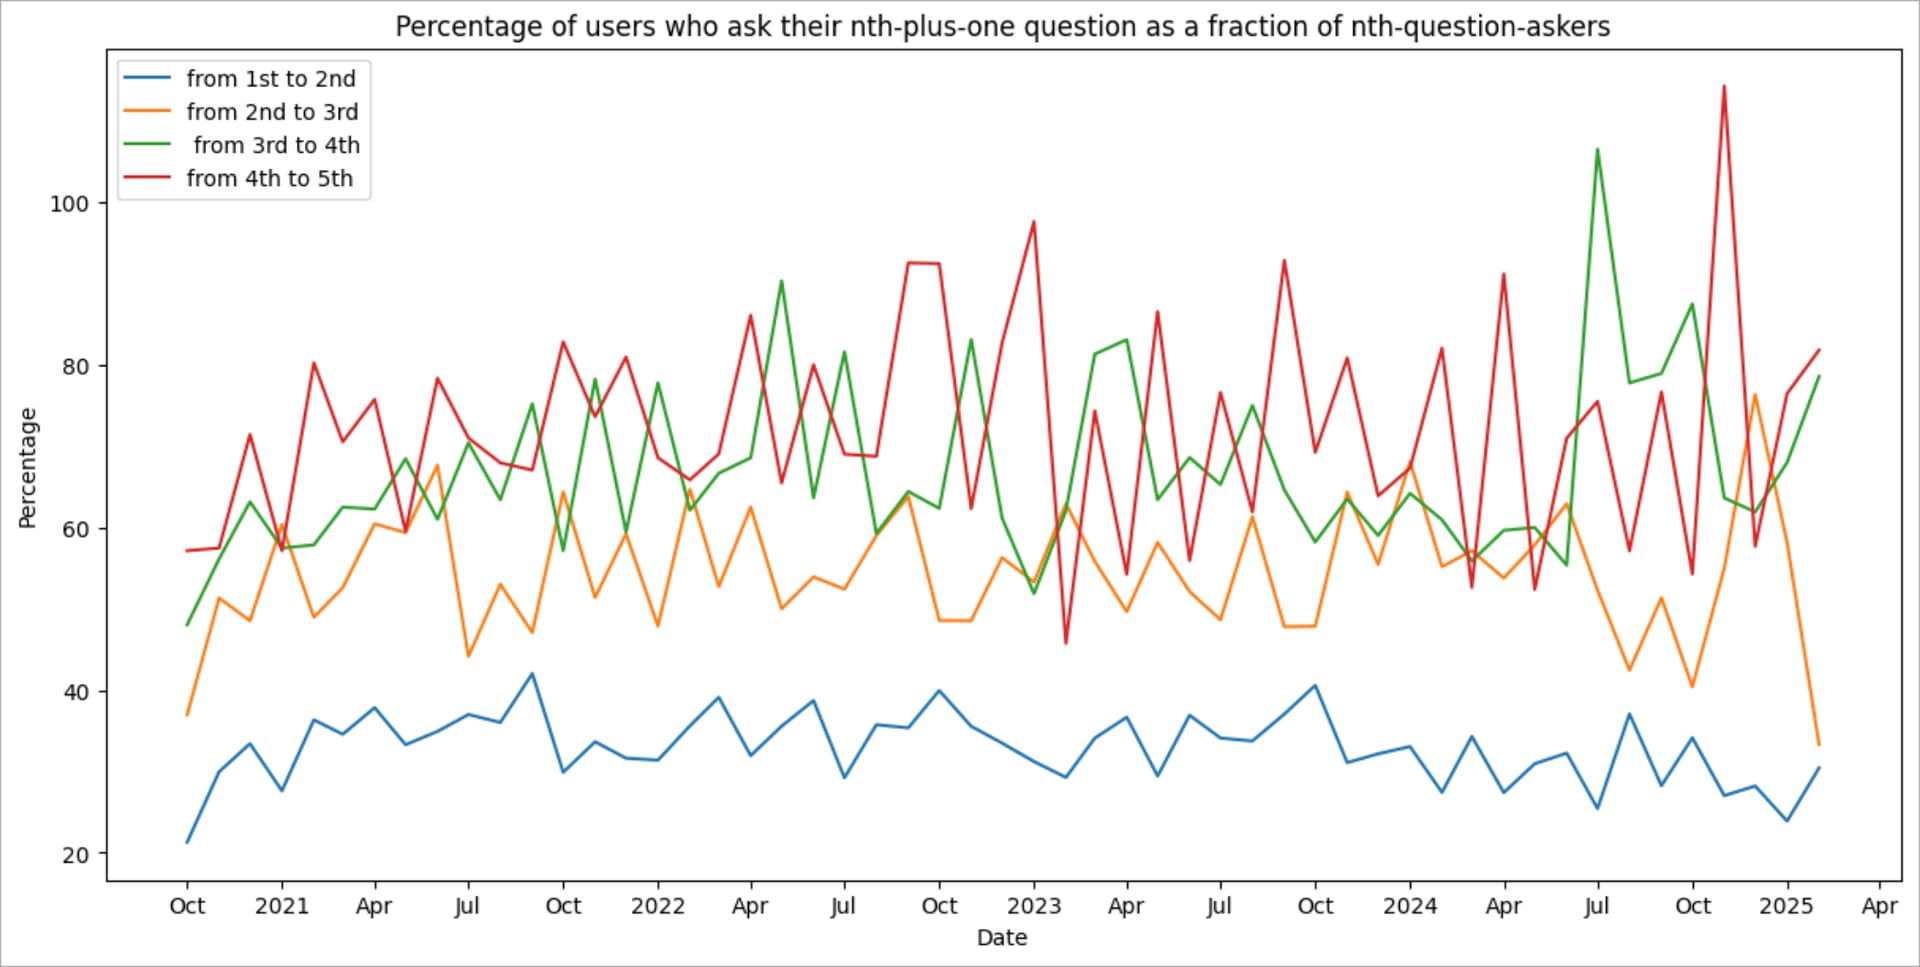
When working at Stack Overflow, I preferred this metric over the percentage of some group among all active askers because this one measures your community performance at every step of the engagement funnel. It will immediately show it
The metric in the benchmark app
I think the above is a solid foundation for any community manager who would like to know the engagement of their users who ask questions.
I’d love to hear your thoughts and comments! =)