It seems to me that the question of how to define “community health” is one of the most controversial topics in the community management field. Why? Because every aspect of community management is important. At the same time, the more metrics a definition includes, the more difficult it is to interpret the result. So whatever you suggest to measure (or not to measure) there will be someone with an argument. But at the end of the day, we still need to measure community health. This is why I want to try to offer you my version of a community health report (or, at least, some food for thought on this topic).
Before moving on, we need to introduce two definitions: First, let’s define an online community.
An online community is a group of people connected by a shared goal, an interest or a purpose and communicating with each other.
The next question is what do we mean by “healthy” community? I usually say that
A healthy community is a community that has more people joining it than people leaving it.
To understand why, think of a city. If there are no people wishing to live in it, it becomes a ghost town. For online communities it is the same.
Based on the two definitions above, we need to measure three things: the people, their engagement, and the value their interactions brings.
Note: Please, let me reiterate on it. There is no such a thing like a perfect, comprehensive metric and, in fact, we do not have a goal to invent one. All we want is to have a short list of measurements that tell us a story based on which we can make better decisions about our community.
Community Health Report
People
The first and the most important part of any community is people. If you do not have people in your community, well…, you have no community. At the same time, almost all online communities have one trait in common which is user attrition. User attrition is a tendency of people leaving a community, so this is why having a constant steady stream of new users is critical. This is why the most important thing to measure in terms of community health is the leave to start ratio.
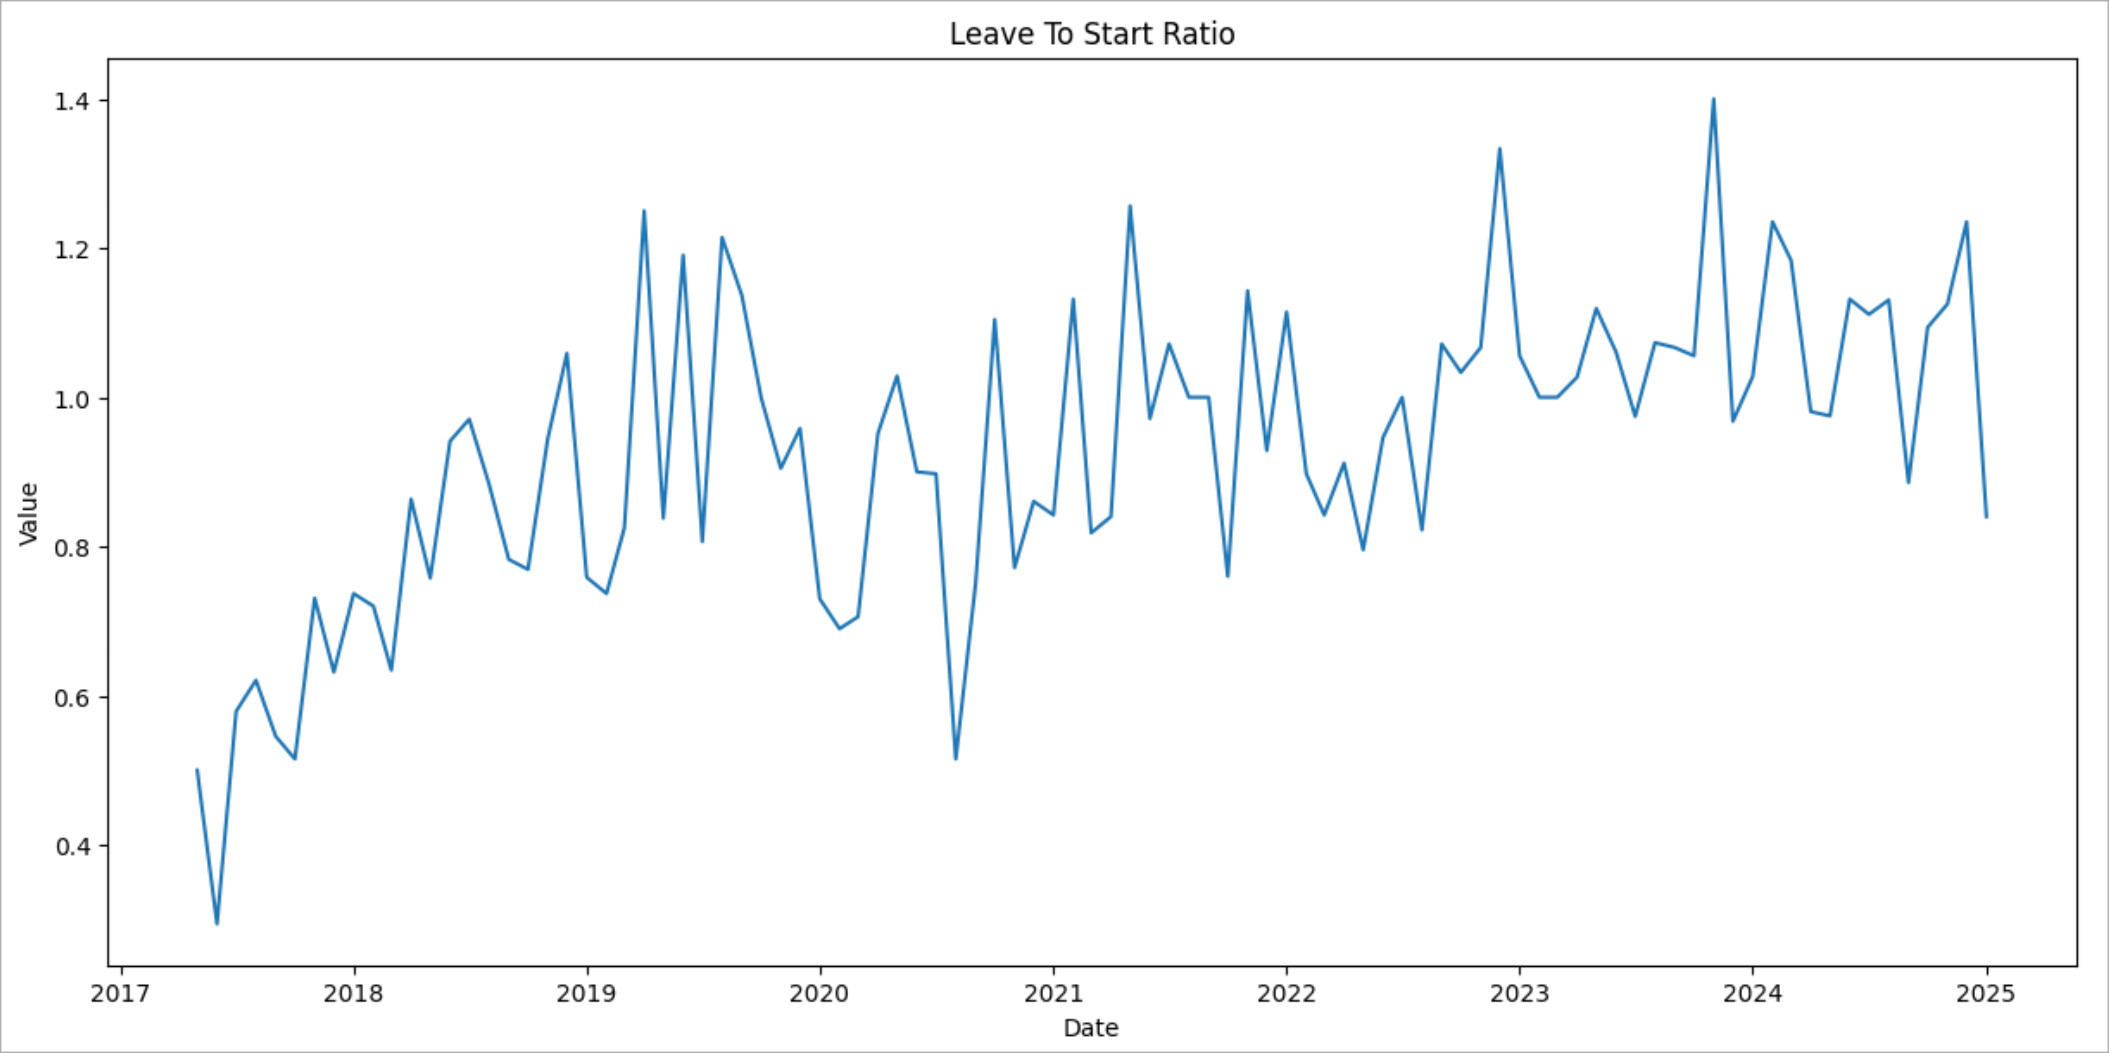
The lower the ratio is, the better things are in your community. If the leave to start ratio is above one, the community is in a danger zone.
The leave to start ratio can be supported by the absolute number of users in the community, to give the reader of the report a full picture.

(Please take a pause here and note how how those two charts change overtime.)
Engagement
Engagement usually means some kind of interaction. One of the good representations of it is contribution frequency. Contribution frequency. says how many actions a user performs during one month period on the days when the user is active.
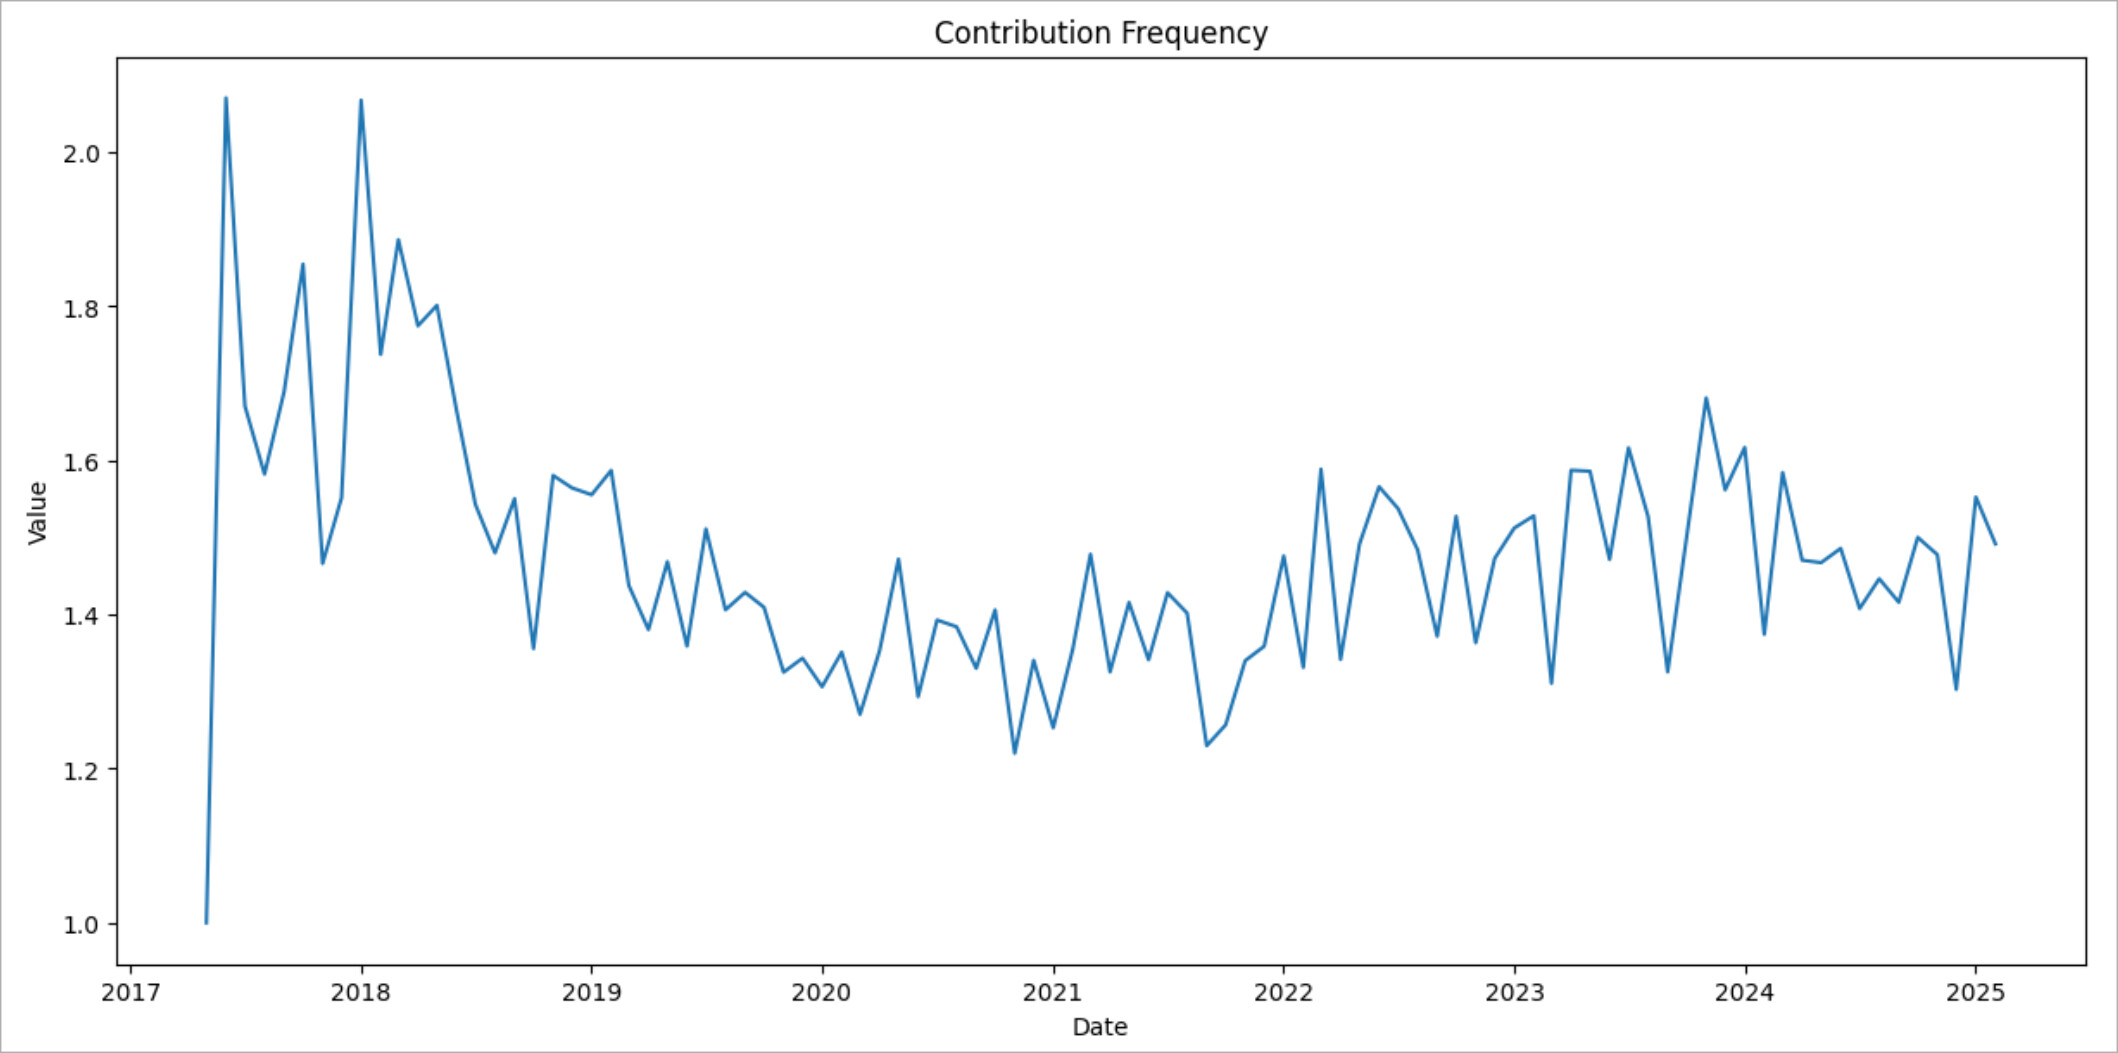
The higher the contribution frequency the better.
There is another measurement that helps one to understand engagement from the other side is utilization. Utilization shows the percentage of users who acted out of those who may act.
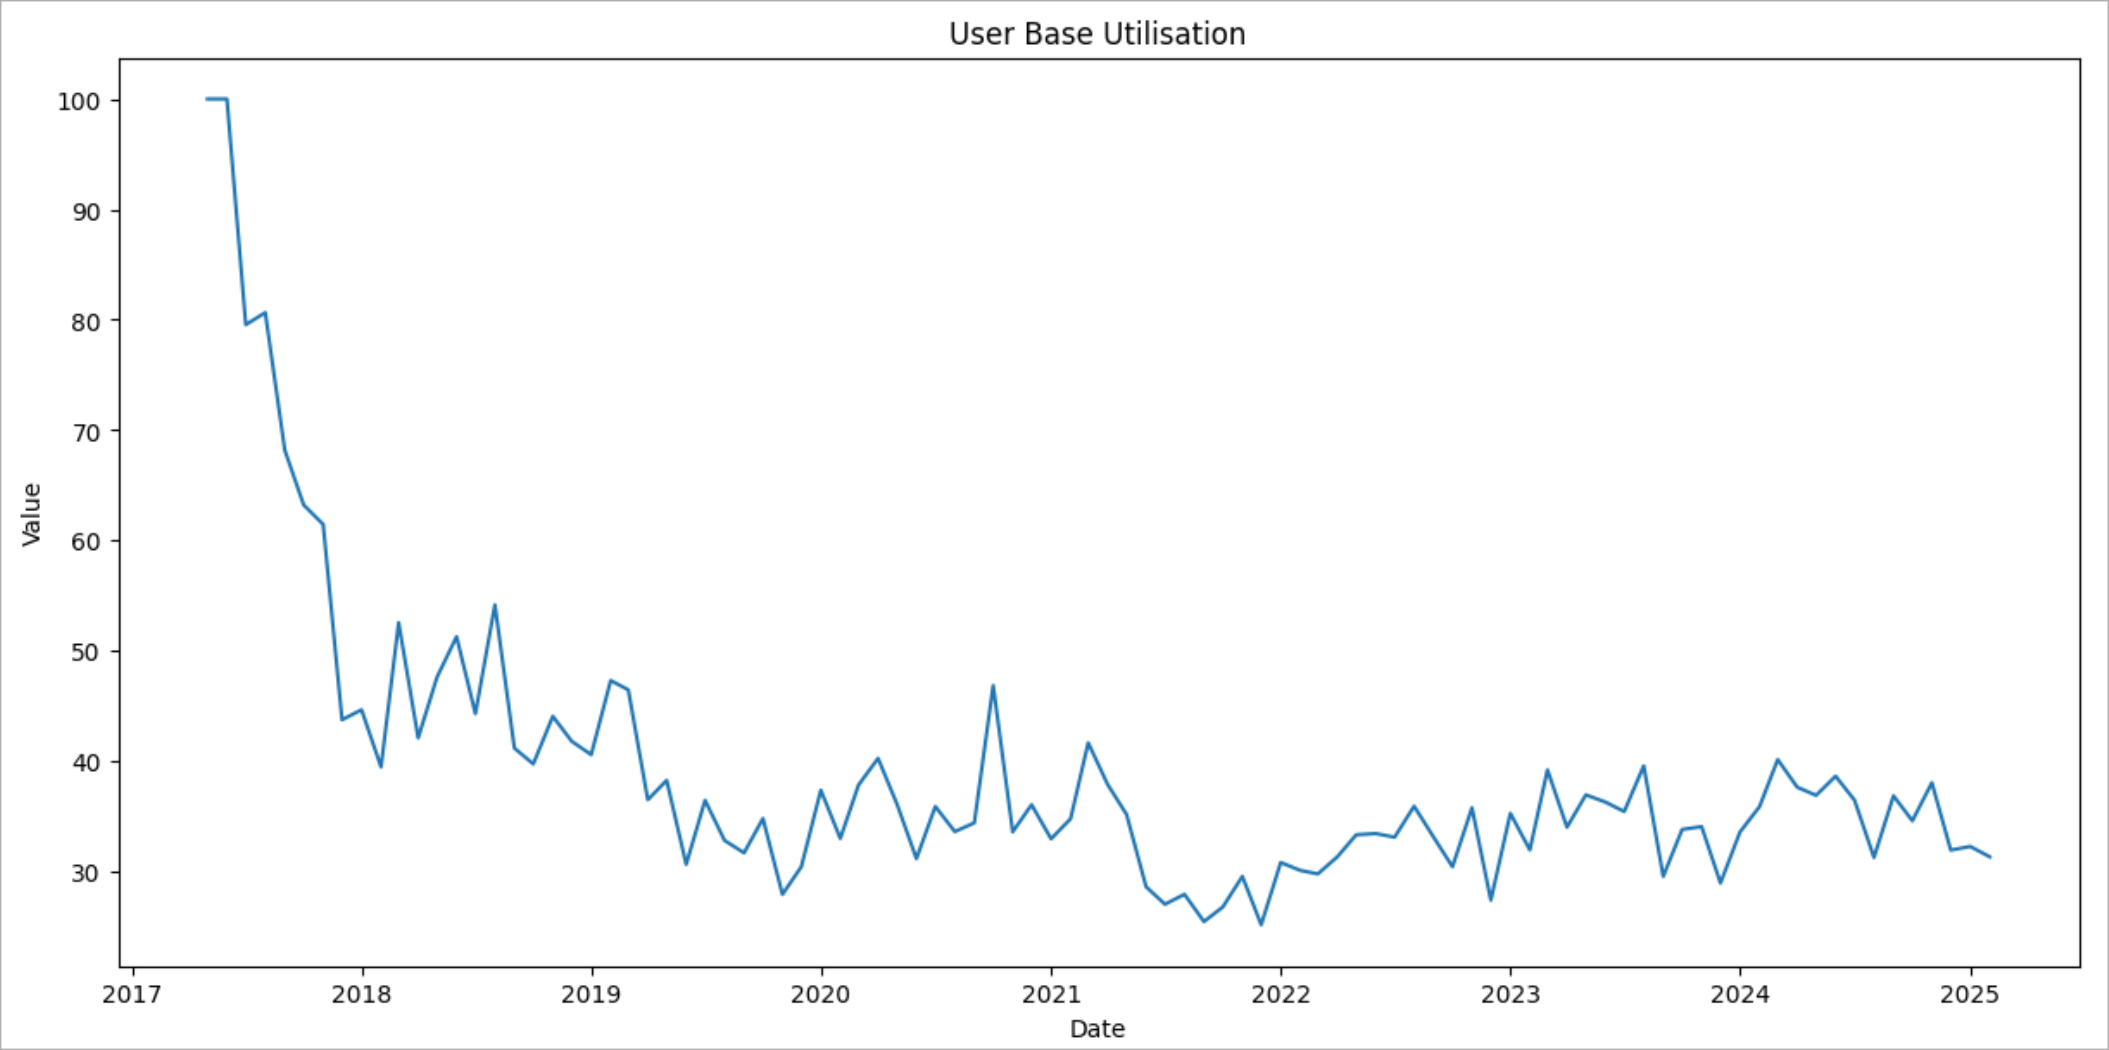
The whole point of this measure is to show you the opportunities in the community, i.e. how the current set of discussions, topics, social initiatives, etc. suits your current user base. Our goal is to maximize this number.
As we know, the user base of any community consists of people with varying levels of engagement. Presenting the leave to start ratio is a good start but we can dig deeper and show how many users are able to reach some level of engagement.
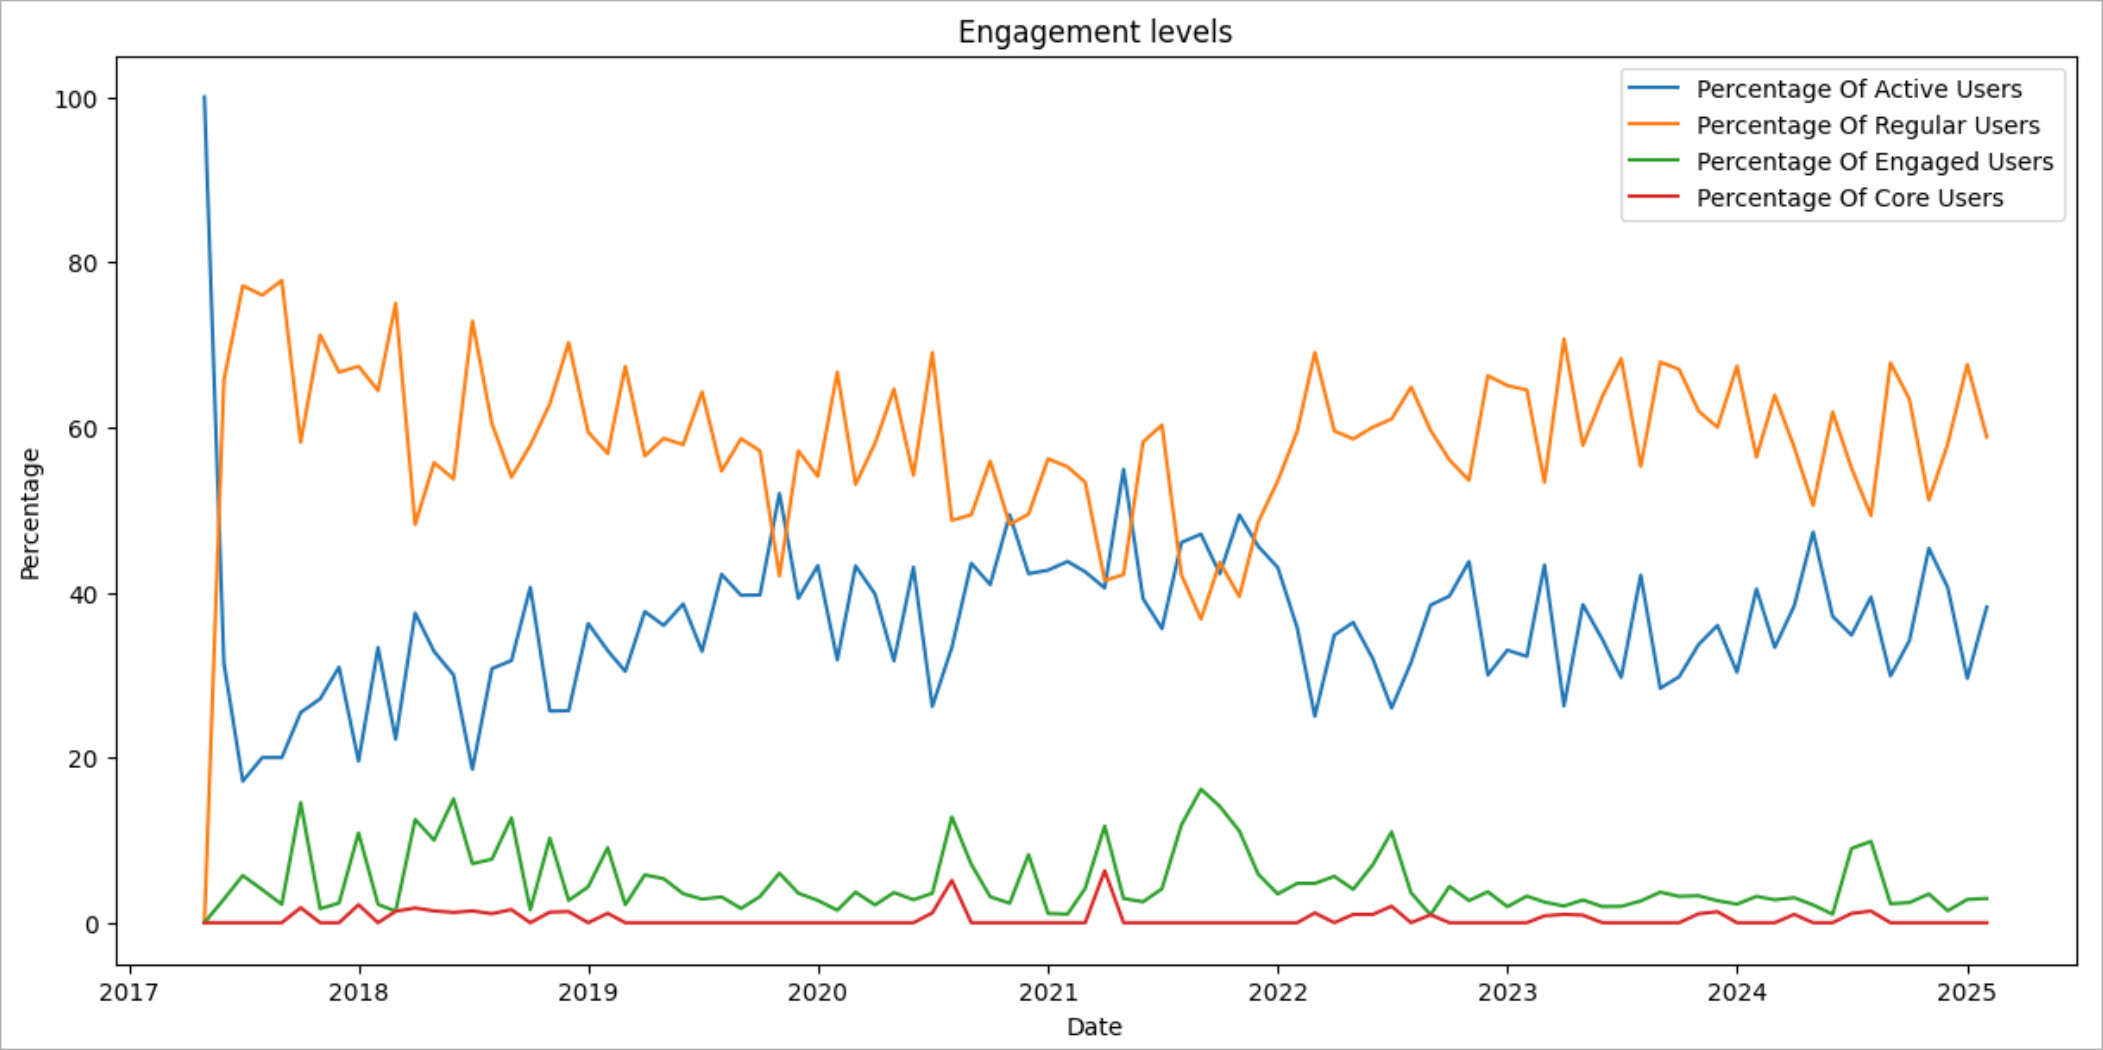
In the charts above, we show the percentage of users (out of all users who have created at least one post) who have acted at a certain level of engagement.
The End Value
The last part of the community health report presents how the community progresses towards its “common goal, shared interest or purpose”.
Any community is created for some reason. For instance, support communities get created in order users of some product can help each other and create a knowledge base for the future users of that product. So we need to measure how the group archives the goal. For an entertainment discussion community, with a goal of making its users smile, it could be a number of anecdotes read on the platform. Another, more real, example is Stack Overflow. For Stack Overflow, according to its mission, the end value is the number of answered questions. (Note that for Stack Overflow, answering is not the same as having an answer. A question is answered when it gets an answer and this answer either gets accepted by the author of the question or gets upvoted by the community.)
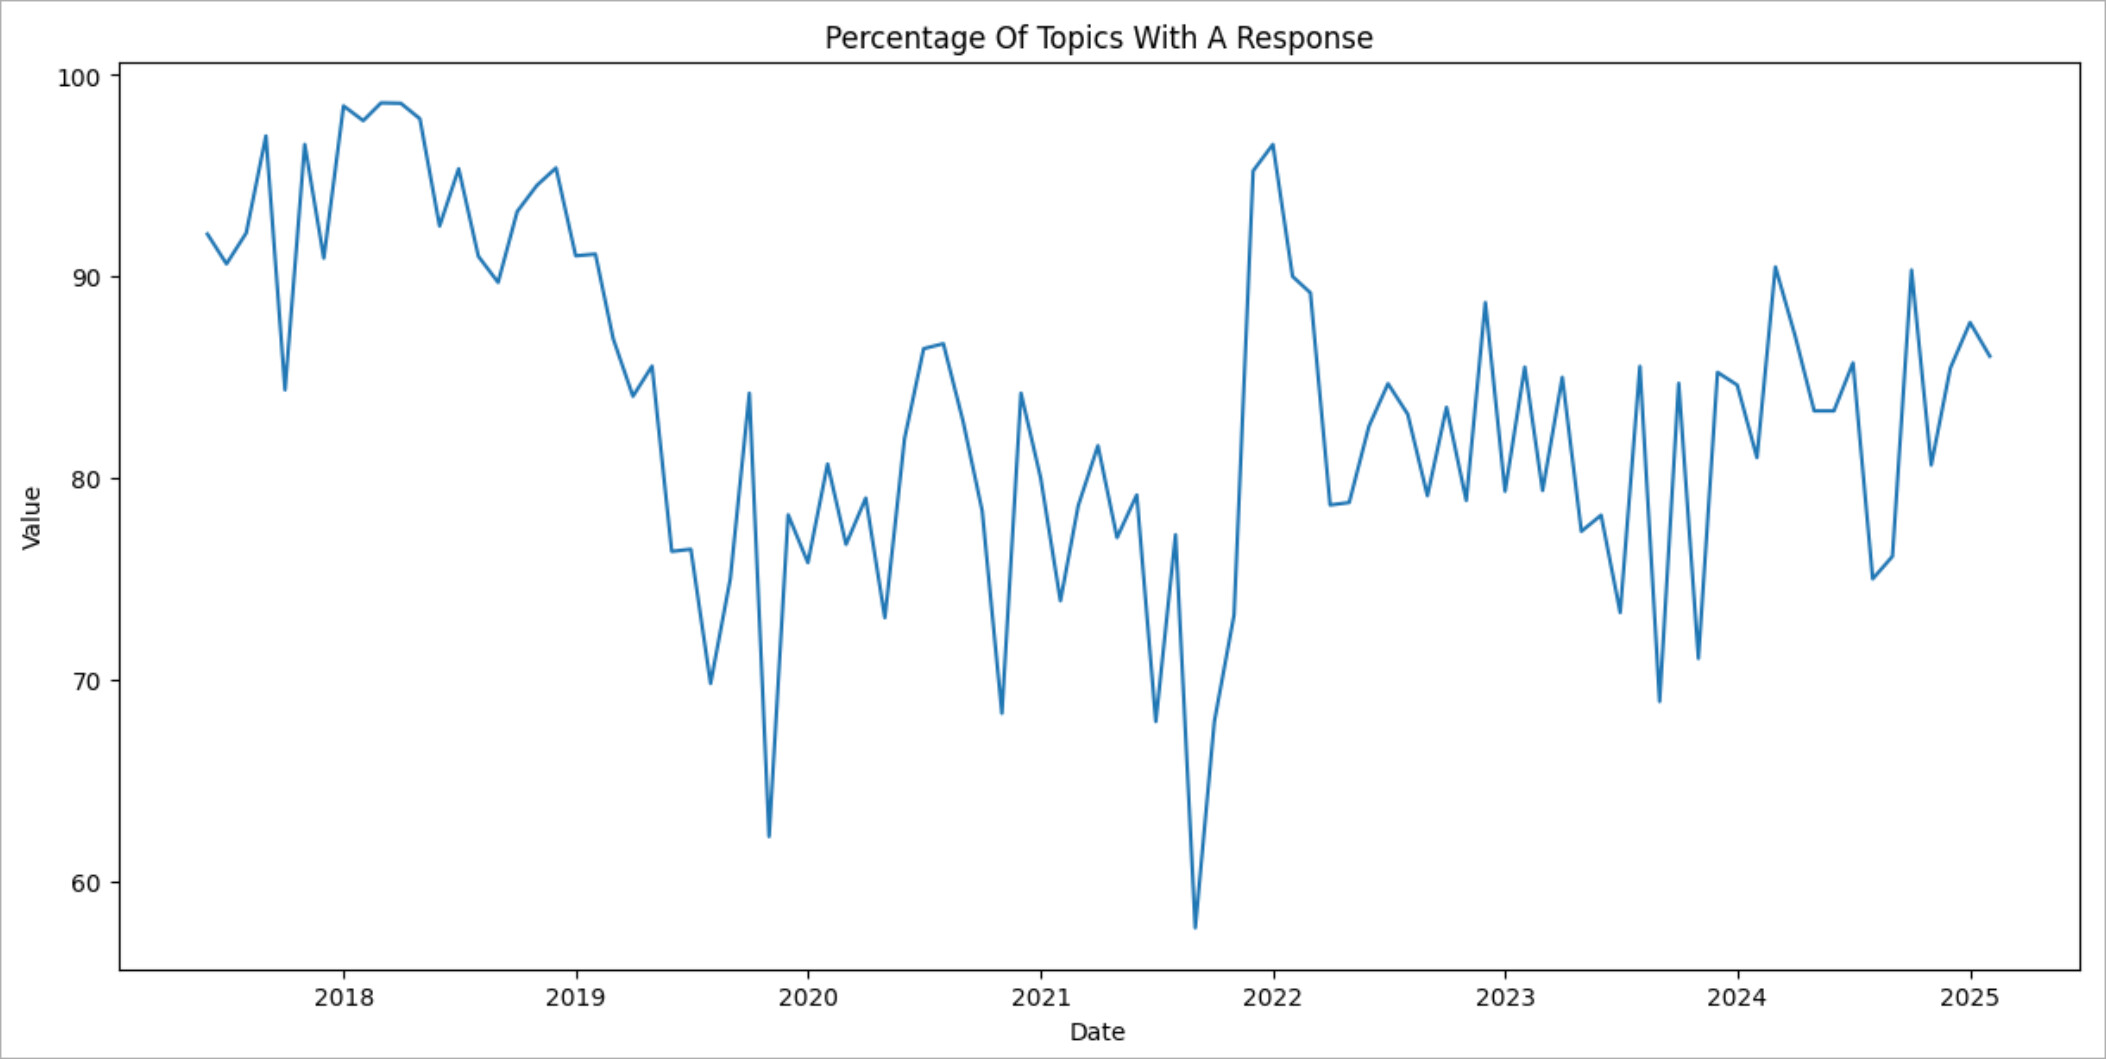
Even though, for online communities the end value varies, we can approximate it with the number (percentage) of threads created that got at least one reply in them because in most cases this is the minimum requirement on the way to generating the end value (no question gets solved or user gets supported without a reply in their threads).
Another high level measurement of the value for a public community is page views the website gets on its content base. Rationality is quite simple. The page views the community receives the more valuable contents the community is creating. (Keeping this fact in mind you can calculate all kinds of interesting metrics, like content performance, content inflation, expected value for a post, etc.
Bonus section for those who have read this far
As a matter of practice, let’s revisit the charts above and see what they say.
As we can see, for the last couple of years the leave to start ratio was very close to one, or even above one for some months. So there are reasons to say that the community is in stagnation mode or declining. The number of monthly active users provides us with the same story (MAU is declining since 2023). At the same time, the contribution frequency is stable and fine. Also we can see that the number of active and regular users has been stable over the last few years but the fewer people were able to reach the engaged or core level of engagement. It seems to me that the community is getting a bit less active users and those who act, act less. So we need to see if everything is fine with the incoming traffic, signup process, etc., and think of some initiatives to maintain the interest of highly active users.
I think this set of metrics describe the health of a community well enough to inform the reasoning about your community decisions.