There are many concepts that we, community managers, use when talking about building and growing a community. These could be engagement, a sense of belonging, trust, or something else. The vast majority of these terms in practice are actions that users perform in the community. Therefore, whatever we do, whatever community building initiatives we conduct, at the end of the day, they all must ultimately impact the number of actions users take on the site. Thus, any way of assessing community management initiatives, in my opinion, will be based on measuring the actions users take on the site or in the app.
This approach is not ideal, but I think it perfectly approximates the processes happening “under the hood” of the community. If this approach feels suspicious, think about the following. If no one in the community posts anything, does not edit anything, or does not perform any other actions at all, is it okay? I think, no. A community without a single participant is a dead community. The more users, the more actions they perform, the higher, in general, the engagement, sense of belonging, trust, etc. Thus, actions taken in the community are a good heuristic to use for measurements.
So, actions. We want to evaluate how well a community management team is performing and we want to do it based on the number of actions users take. Let’s think about how a community management team can influence activity on a site. In my opinion, in general, there are two ways to influence the number of actions.
- By bringing more new active users.
- By making existing active users start performing more actions.
Here are some metrics on how to measure both.
New users
Number of new active users
Depending on the context, we can use the number of users who became active in the community either as a percentage of the total number of active users for the period, or as an absolute number.
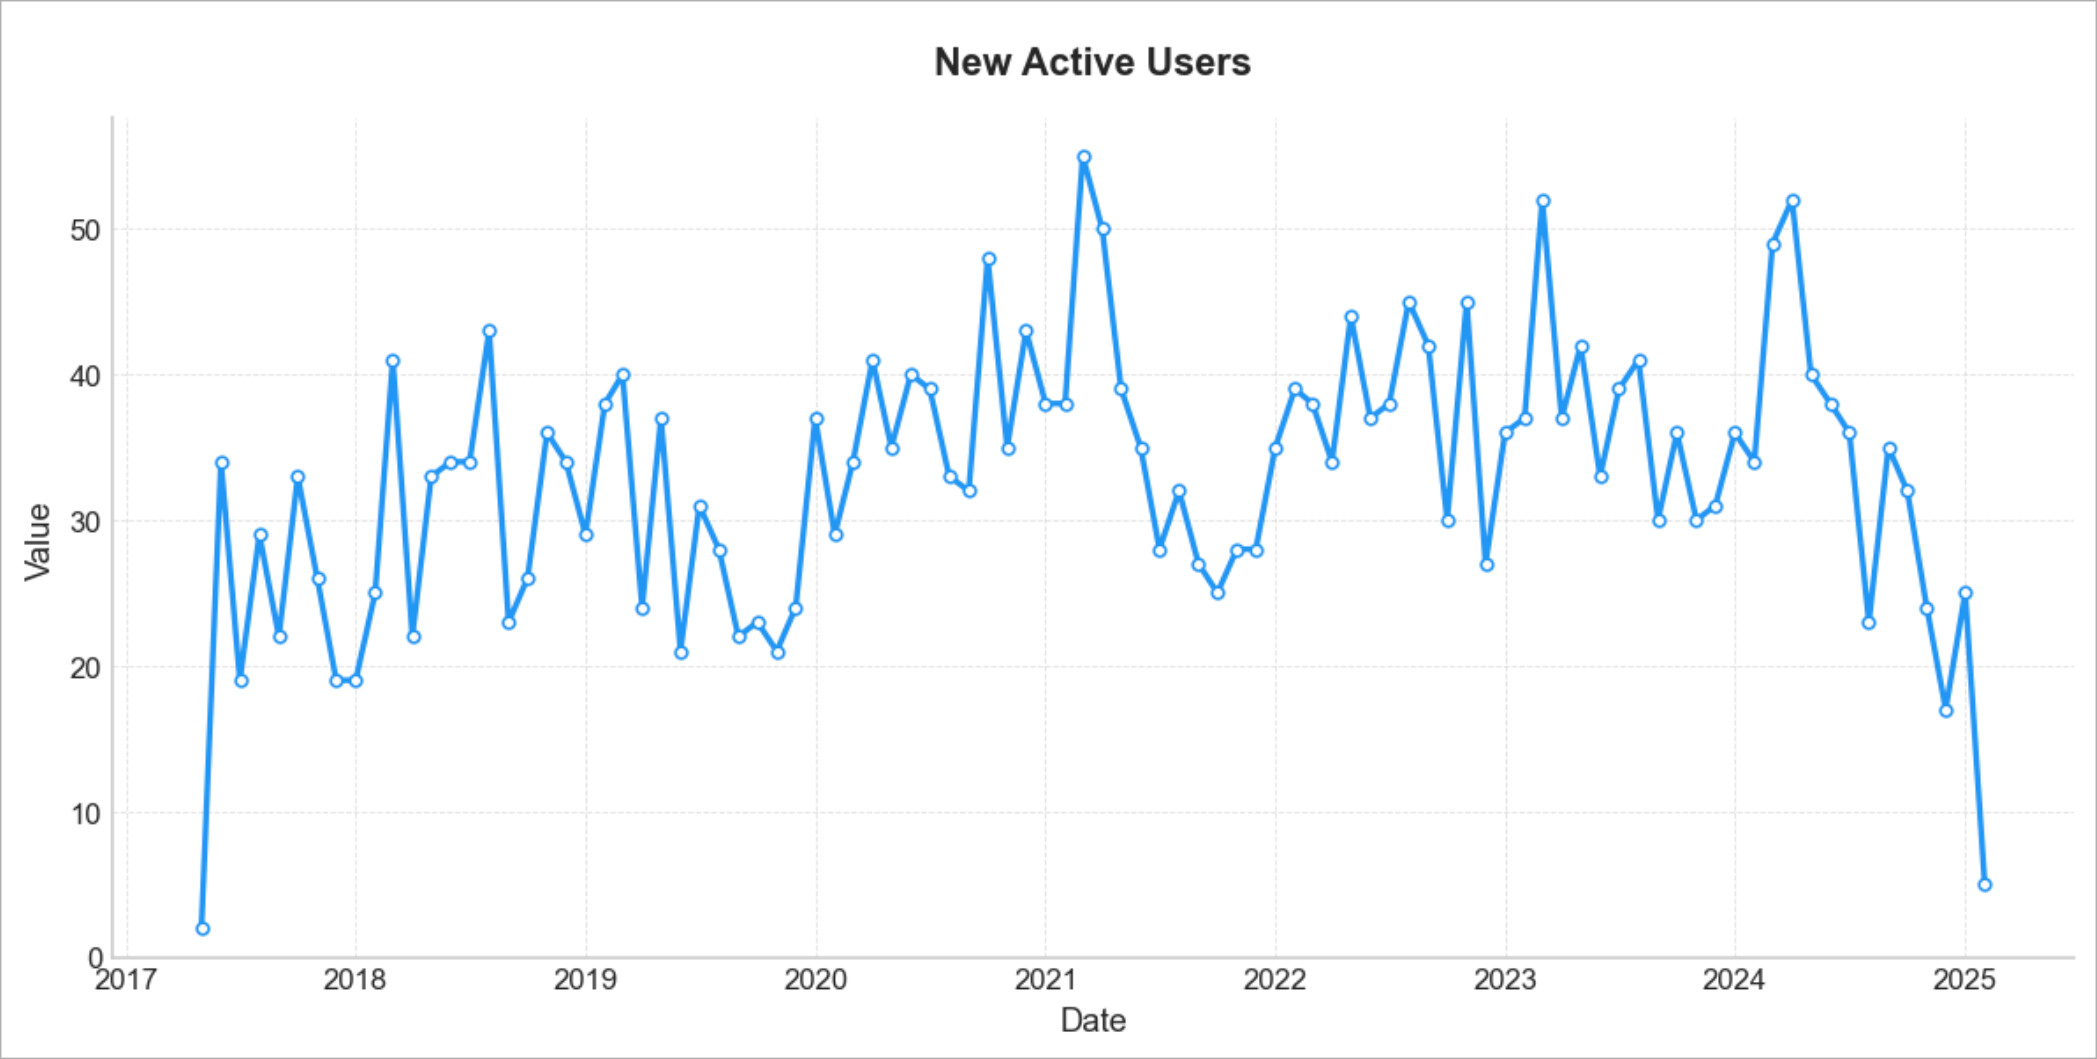
I prefer to report an absolute number as it shows us the volume. The bigger the number, the better. It is worth mentioning that the community management team, in general, does not have a direct influence on the number of new active users in the community. Usually, the marketing team deals with incoming traffic. Nevertheless, the number of users who start acting is an important part of the overall story (and sometimes the marketing team and the community team are the same thing.)
Leave to start ratio
Let me repeat myself once again:
A healthy community is one where more members join than leave.
Churn is a natural trait of any community. The goal of the community management team is to make sure that users stay in the community as long as possible (and thus take more actions).
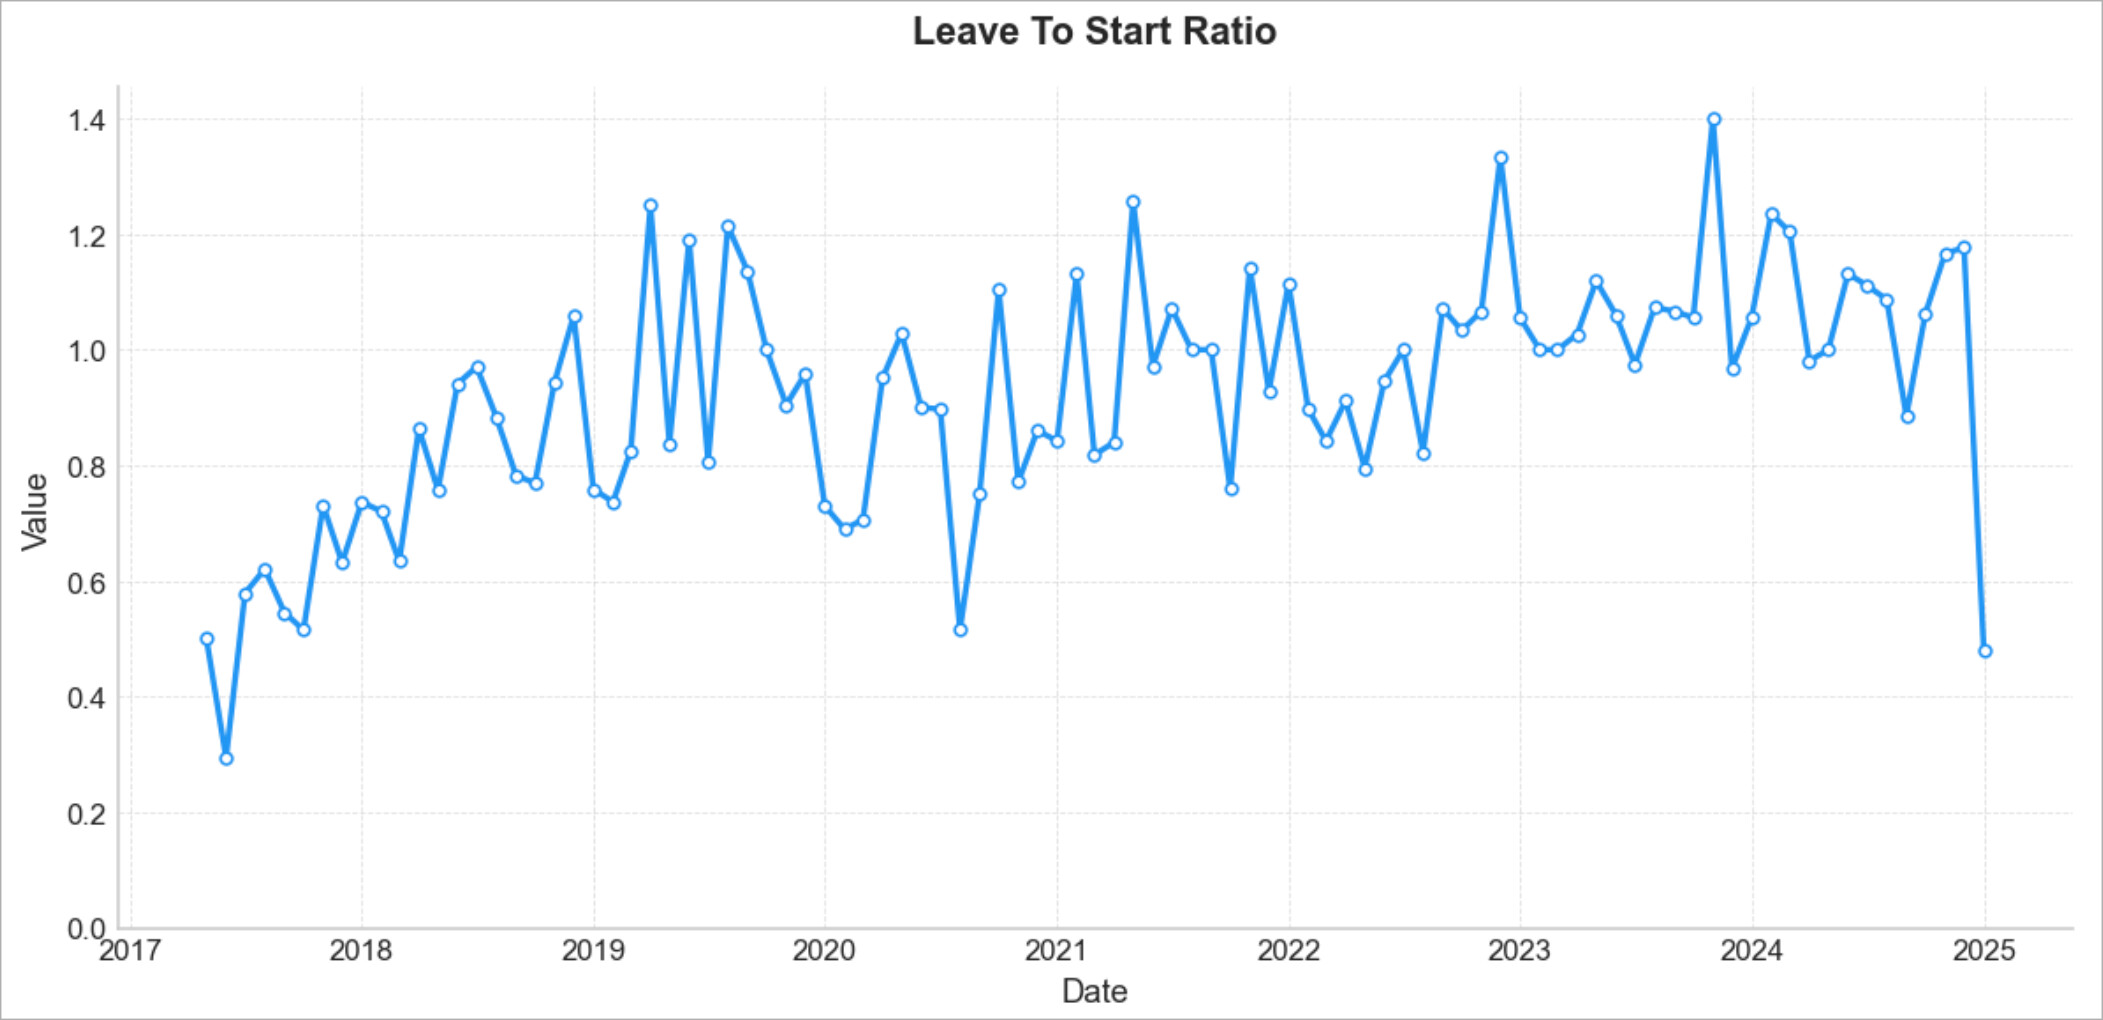
The number of users who left the community is in the numerator, so the lower the value of the metric, the more effective the community building initiatives were during the period. If the value of the metric is equal to one, then the number of those who leave and those who start acting is equal. Any value greater than one signals serious problems in the community.
Existing users
Now let’s talk about the existing users. The community manager can influence two parameters of user participation:
-
Duration of participation, i.e. the period from the first activity on the community to the last activity on the community.
-
The number of actions performed during the participation period.
If the community building initiatives are chosen correctly and well run then both parameters should grow.
Here there is a problem that at a given random point in time it is hard to say if a user left the community or is going to act in the future. We have three options to go about this.
-
Consider the duration to be the same for everyone and equal to the reporting period (one month in our case). In this case, we need to calculate two metrics: the average number of days when users are active and the average number of activities per active day for our user base.
-
We can also consider the duration of activity to be the same as above, but calculate only one metric: contribution frequency, as it shows the average number of actions per active day.
-
Calculate the duration of participation regardless of the fact that the measurements will have some lag.
Let’s see how each approach looks.
Average number of active days, average number of activities per active day and contribution frequency
Number of active days per month
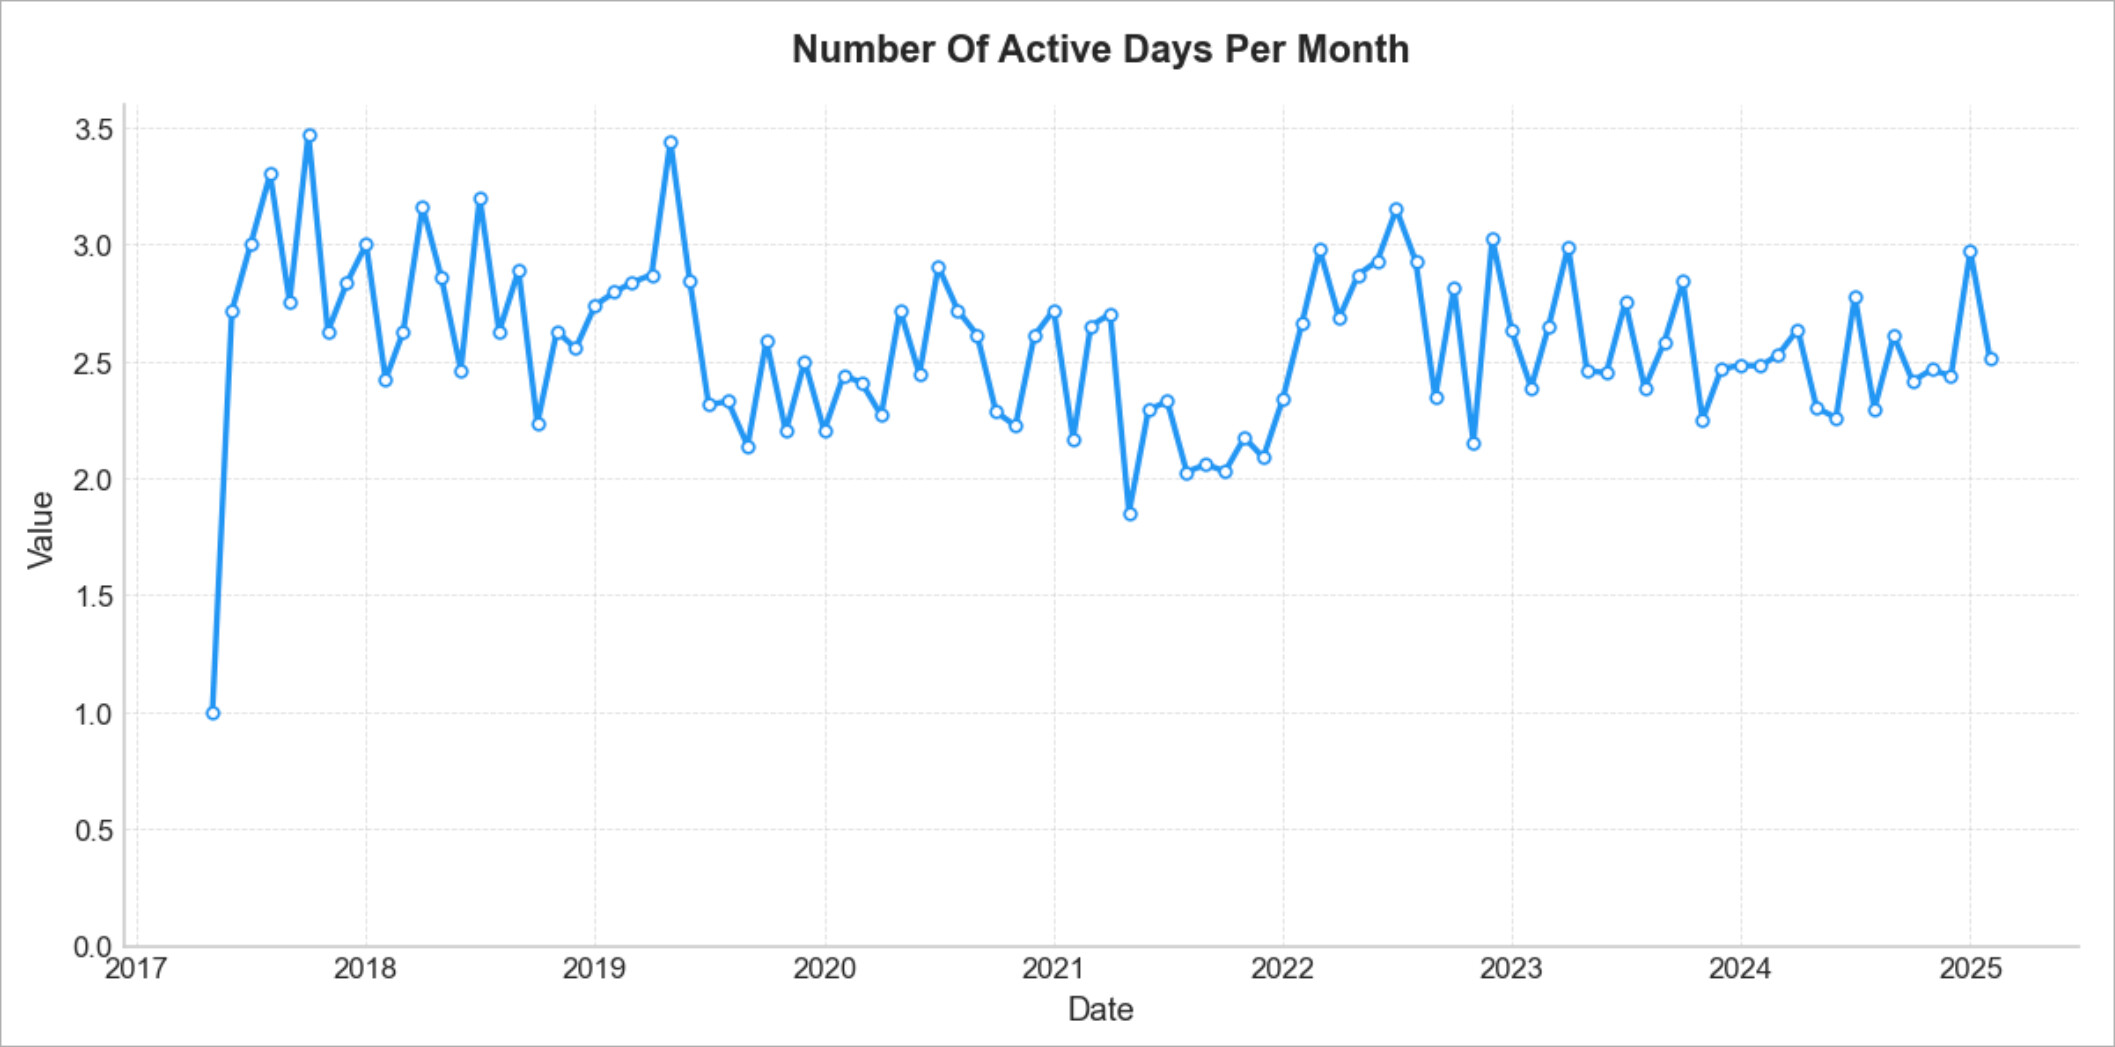
This metric shows the average number of days during the one month period when users are active in the community. It helps to understand how frequently people perform actions in the community. The higher the value, the better, though it is limited from above by the number of days in a month.
Number of actions per month
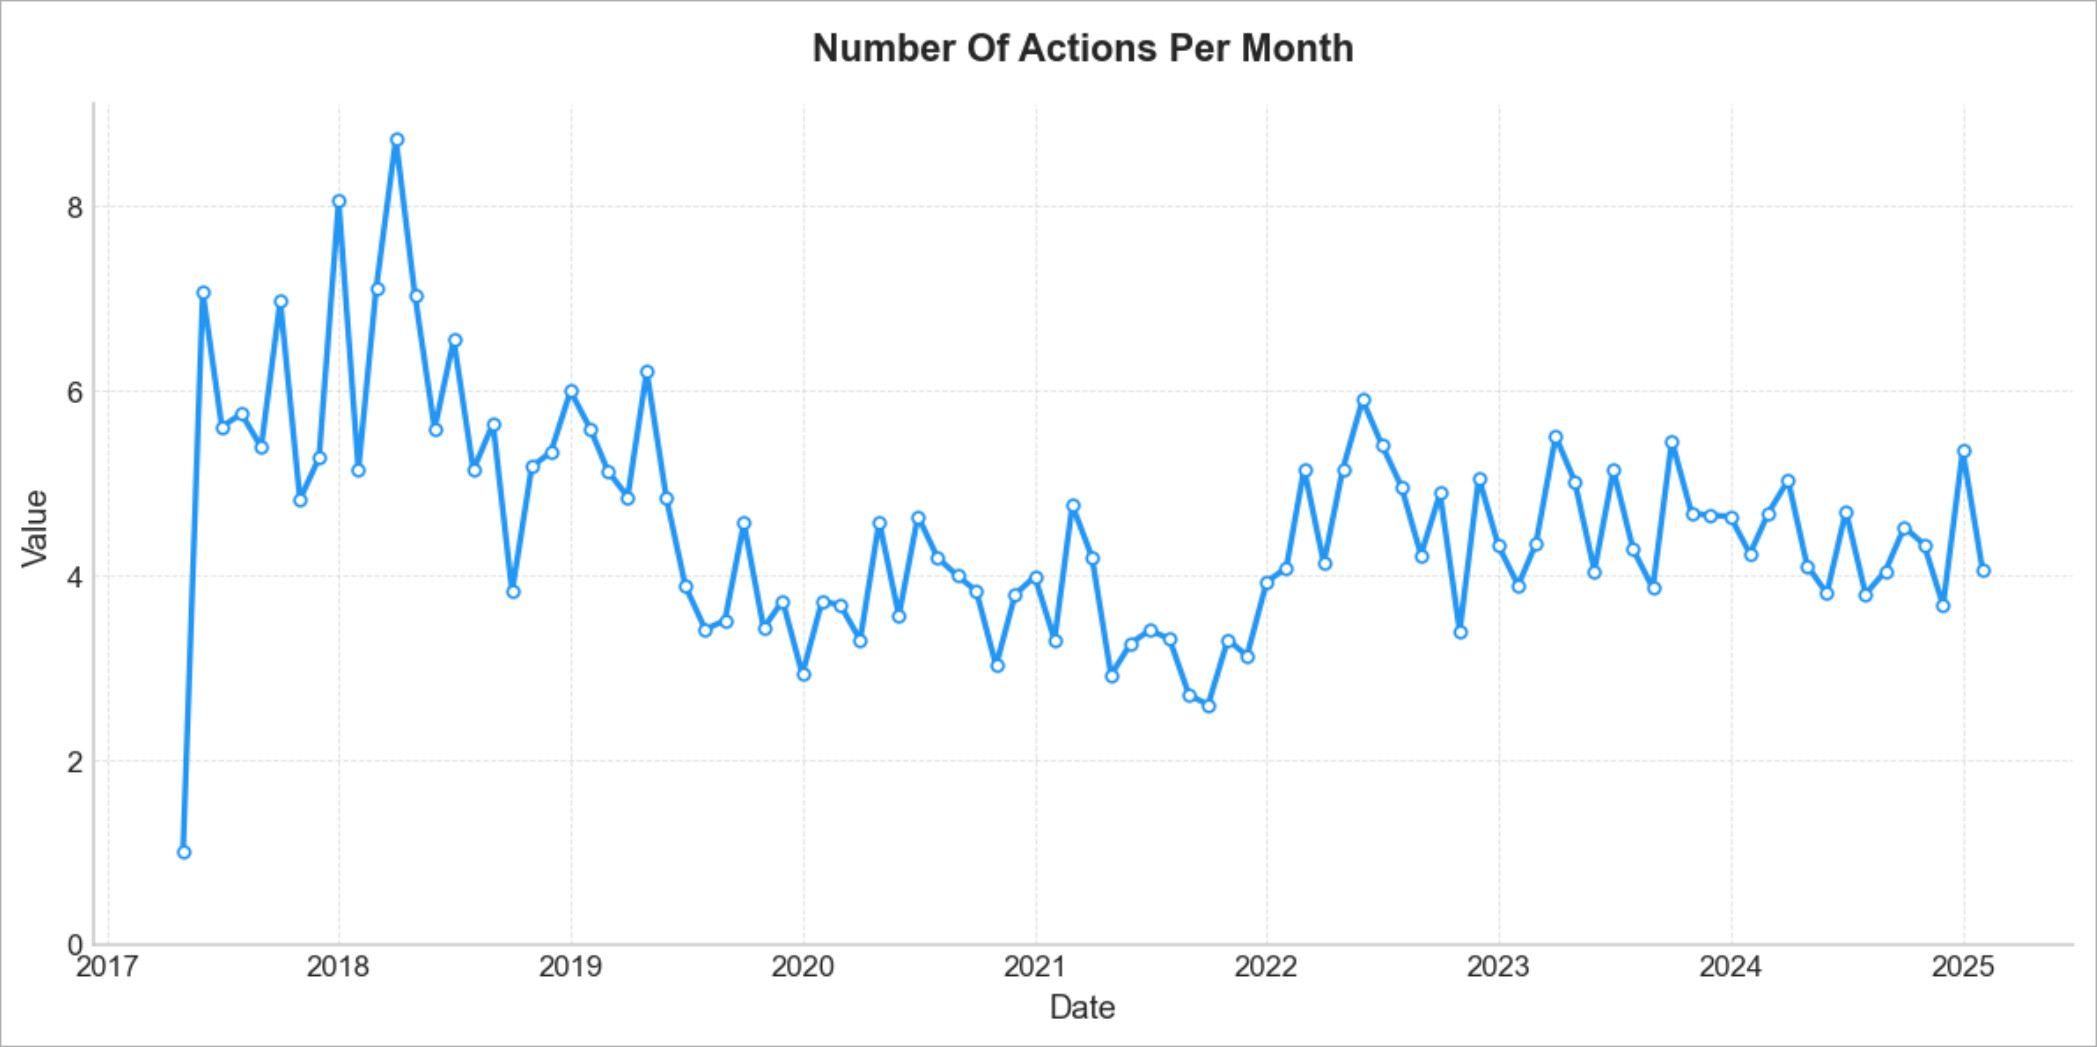
This metric shows the average number of actions users perform in the community during the one month period. It helps to understand how many contributions people make in the community. Here we want to have high values as well.
Contribution frequency

Contribution frequency shows how many activities users perform on average during the selected period of time on the days they are active. Эта составная метрика, которую мы получаем поделив количество активностей на количество активных дней.
Duration of participation and the number of actions performed during the participation period
If we go with this approach we need to keep in mind a few things:
-
We need to make sure that all participants have equal opportunities to “show off themselves”. To do this, we need:
- Include in the calculation for the period only users who began participating on the site in the selected period.
- “Cut off participation end dates” for users who participate longer than a certain threshold (and drop the actions that do not fit the period).
-
In some cases, it makes sense to exclude users who participated only once.
-
Once again, metrics of our interest have a lag, thus value for past periods may change over time, as some members may return to the community after a long time.
Average length of participation (user tenure)
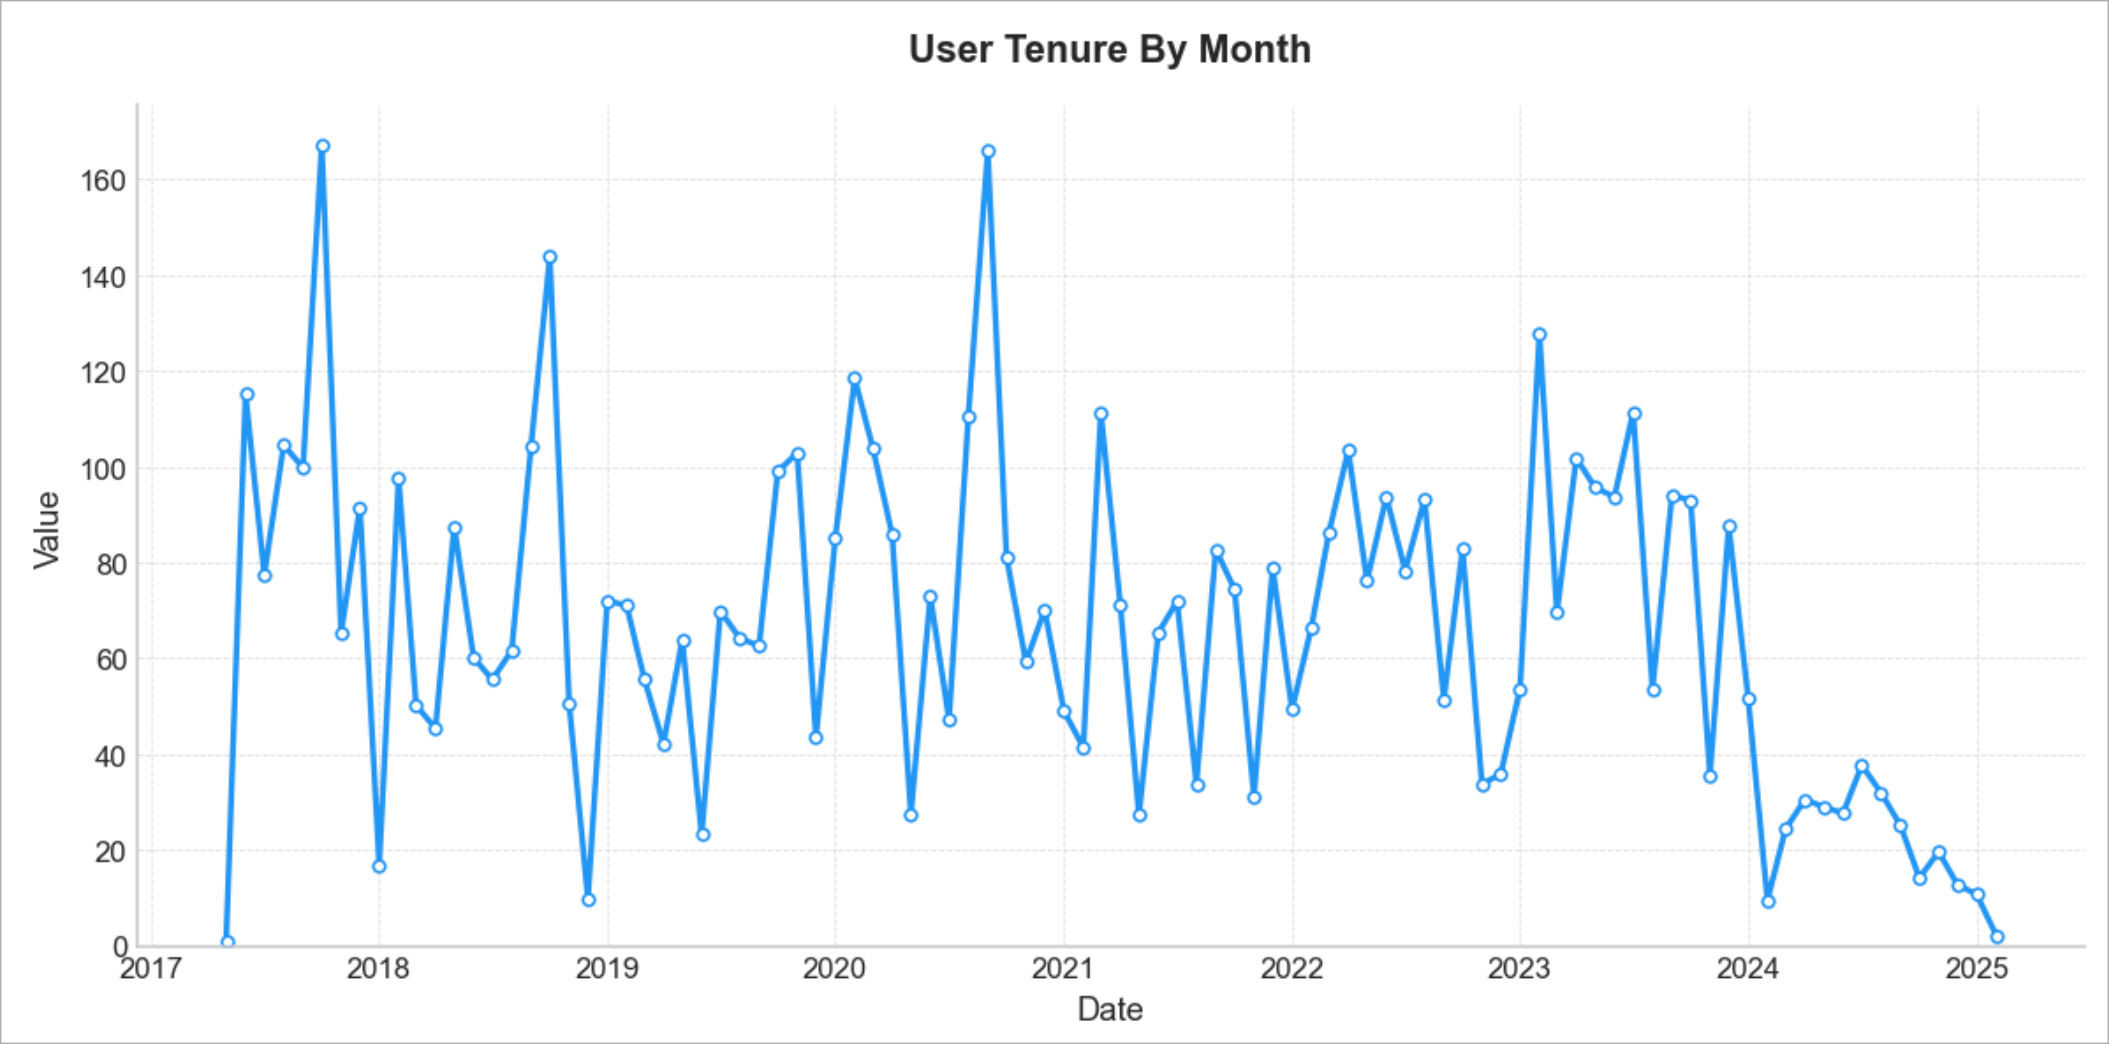
The higher the value, the more users stay on the site for a longer period. The higher the participation threshold cut off, the higher the average value can be, as users with a longer membership history will appear.
Note: in my calculation I use a 2 year cut-off threshold at the same time, as our benchmarks say, the average length of participation is around two months
Average number of actions taken during tenure
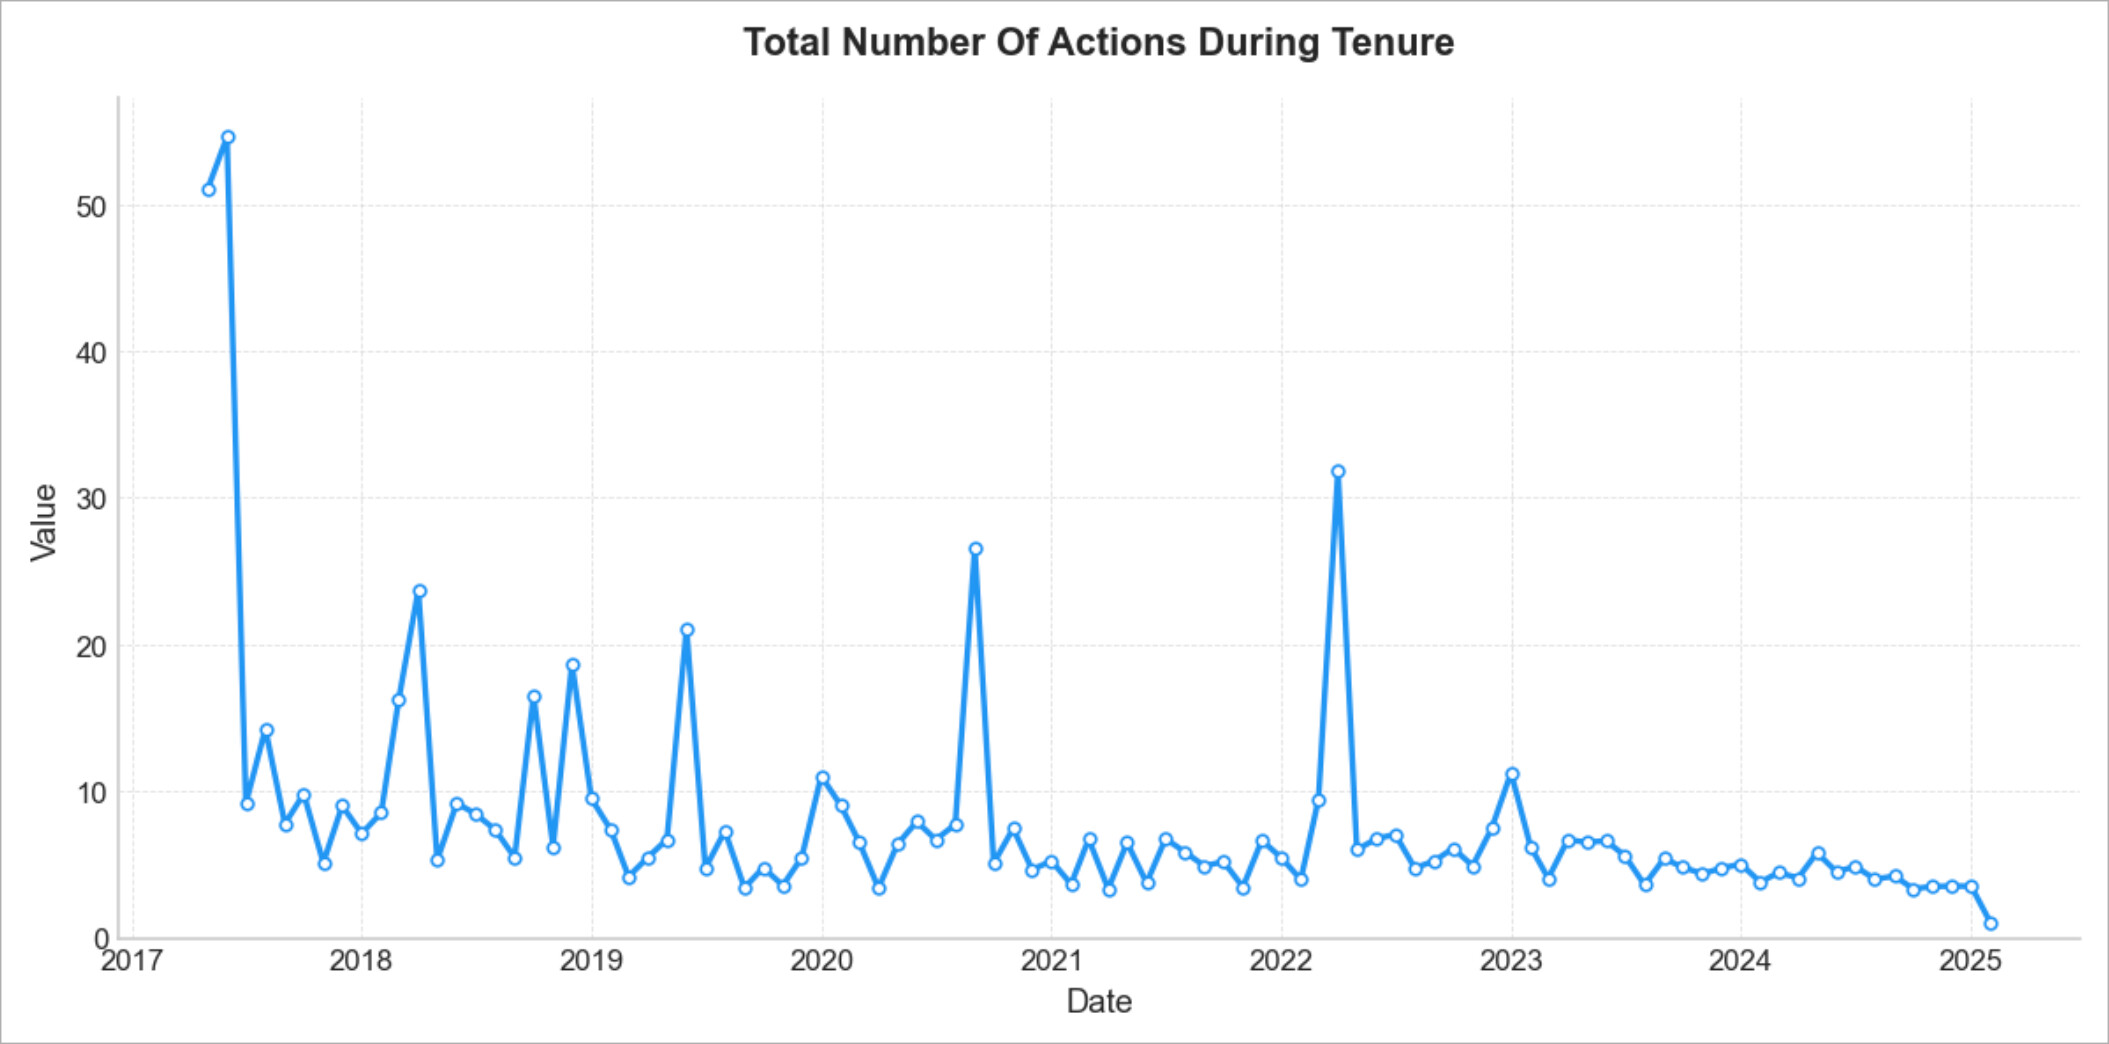
The higher the value, the more activities each user contributes. Increasing the threshold for participation duration cut off will increase the average value due to very active users.
How to read the report?
- In the community industry, everything starts and ends with users. If your community doesn’t have a constant influx of new users, it’s in big trouble.
- If you have a stable influx of new users, but the user churn is high, the community still has serious troubles.
- Next thing to look at is the user tenure and the number of actions taken during the tenure. Our goal is to increase both, i.e. have more users to stay longer and contribute more. (Please note that at this point we assume that the number of new active users is stable or even growing. If it is not true, the interpretation will be different. Also do not forget that tenure itself is a lagging metric and you might want to look at monthly stats like the number of active days and the number of actions per month.
For our particular case,
- The number of new active users has been trending down since mid-2024. It is not good.
- The leave to start ratio is above 1 for most months during the same period which makes the situation even worse: even if we have some new users joining the community the churn is higher.
- The number of active days per month and number of actions taken per months are stable.
- The contribution frequency is stable as well.
My conclusion is as follows. The engagement on the platform is fine but the community team needs to double down on onboarding and working with new users.
I’d love to hear your feedback! Do you measure the performance of your community initiatives or assessing your community team? If yes, how do you do it? Does the proposed report meet your needs?