
People gather in online communities to do something together, whether it’s to talk about common interests or to support each other in difficult life situations. So the two most important ingredients of a successful community are (1) people and (2) their interactions between each other. When we want to measure the “interaction” part of the equestion, we start talking in terms of “engagement.”
Engagement in online communities measures how actively and consistently members contribute.
Engagement is connected to another important concept - a sense of belonging, which arises through constant positive interactions in the community. In general we can say that the more activities a user performs, the higher their sense of belonging can be expected.
So, let’s try to measure user engagement!
What is the shortest list of metrics that will tell us a comprehensive enough story about engagement in our community?
As we already know, when we talk about characterizing engagement in a community, we want to measure the number of actions users perform. This number can be broken down into two components: (1) the number of active users and (2) how active each of them is.
1. Monthly active users
One of the key metrics we use over and over again is the number of users who have completed at least one significant action in a given time period (in our case, a month).
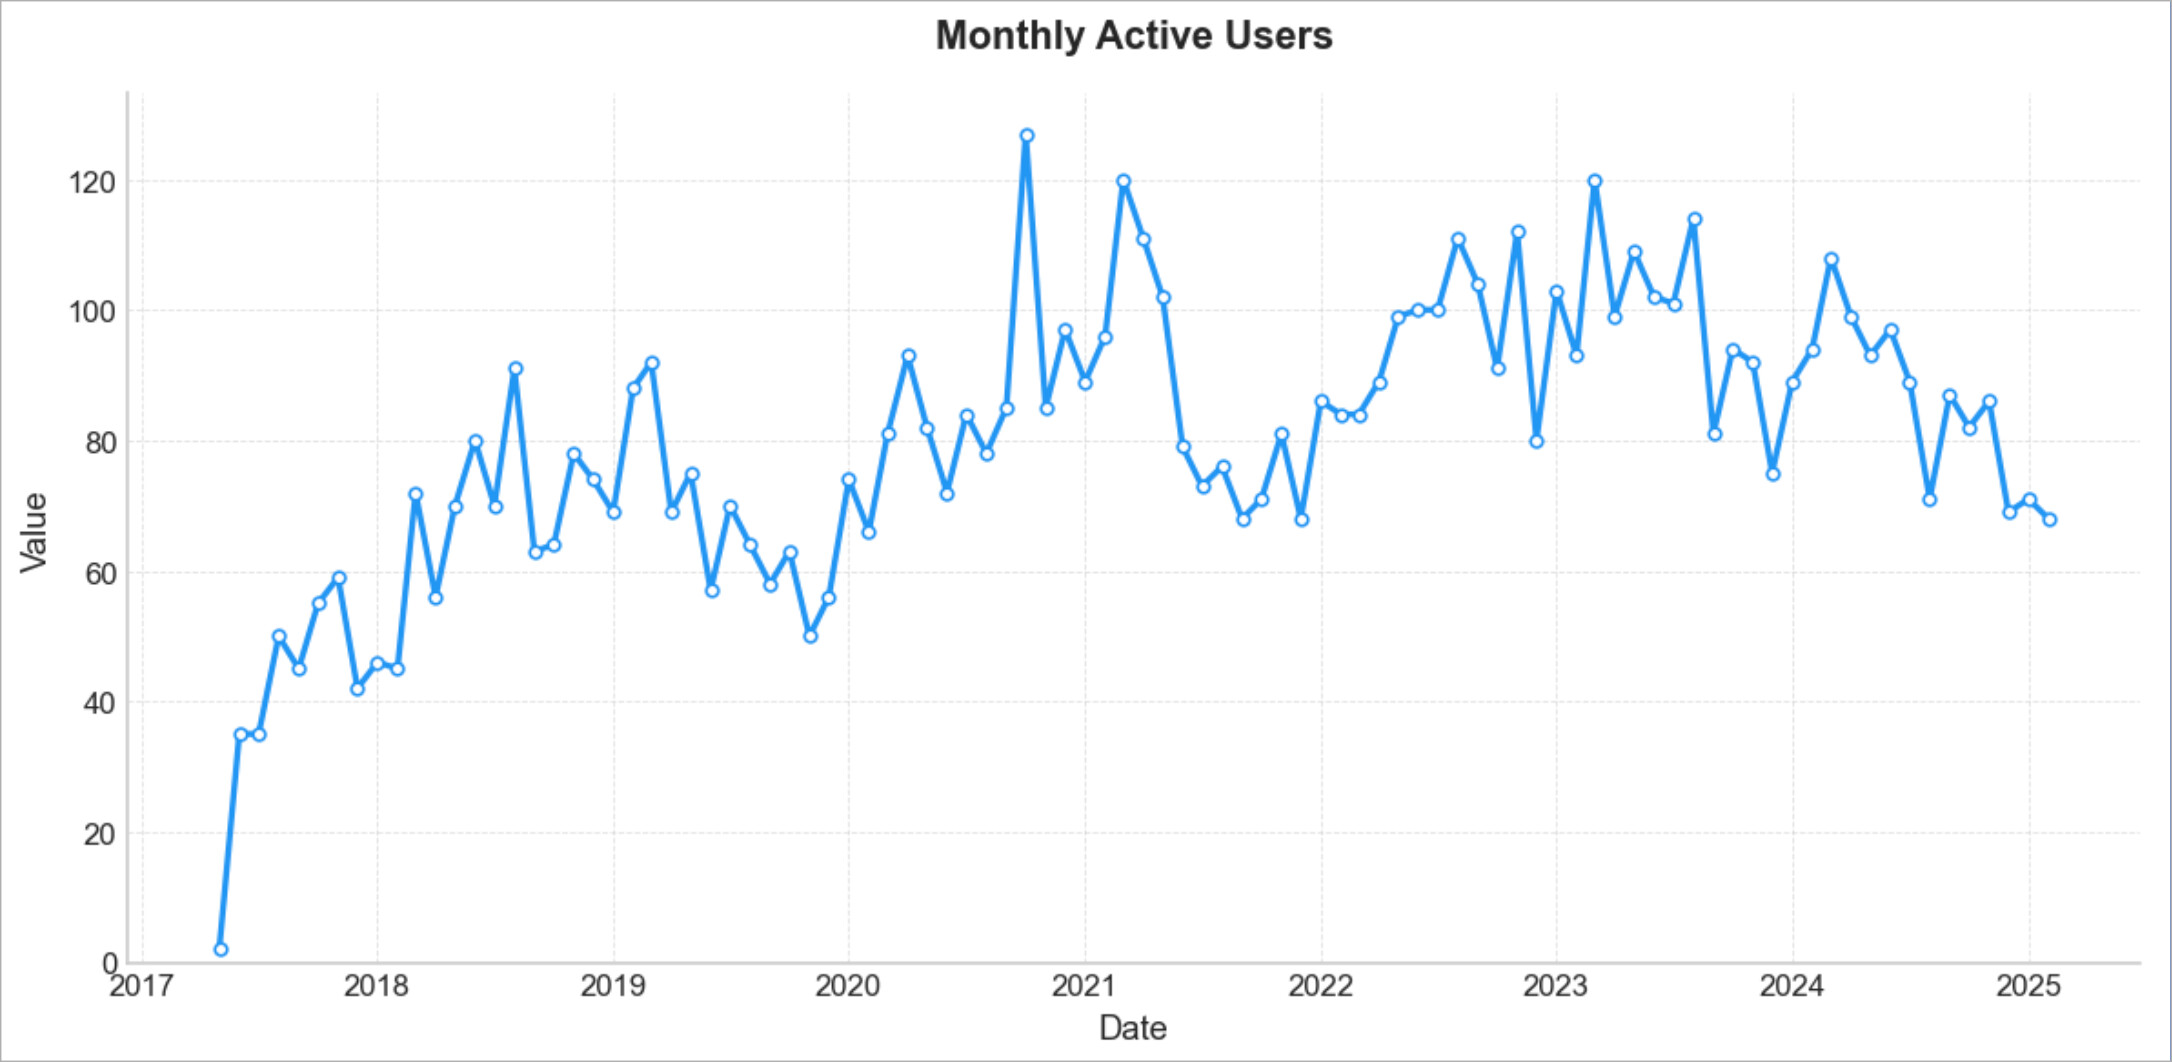
The more active users we have, the better.
2. User engagement summary
To grasp the level of engagement on the user level, we need to break the entire community into smaller groups with common engagement characteristics, the engagement cohorts. We have already talked about how to create those cohorts earlier, so we know that the two charts to present here are:
- Percent of users in each cohort
- Percent of content created by each cohort
Please note that If you work on an executive summary report and you already have a ton of charts I would recommend you consider presenting the following three statistic in the text form instead of the charts mentioned above:
- Maximum engagement level reached — the top cohort at which you had at least three users last month.
- Engagement levels split in the form of “% Of Active Users / % Of Regular Users / % Of Engaged Users / % Of Core Users / % Of Super Users”
- Volume of posts by cohort. The same as above but for the amount of content created by each cohort.
More details: Engagement numbers for each cohort
In the case you need to look at the details of each cohort, I’d recommend you to have the following information for each of them.
Number of users in a cohort
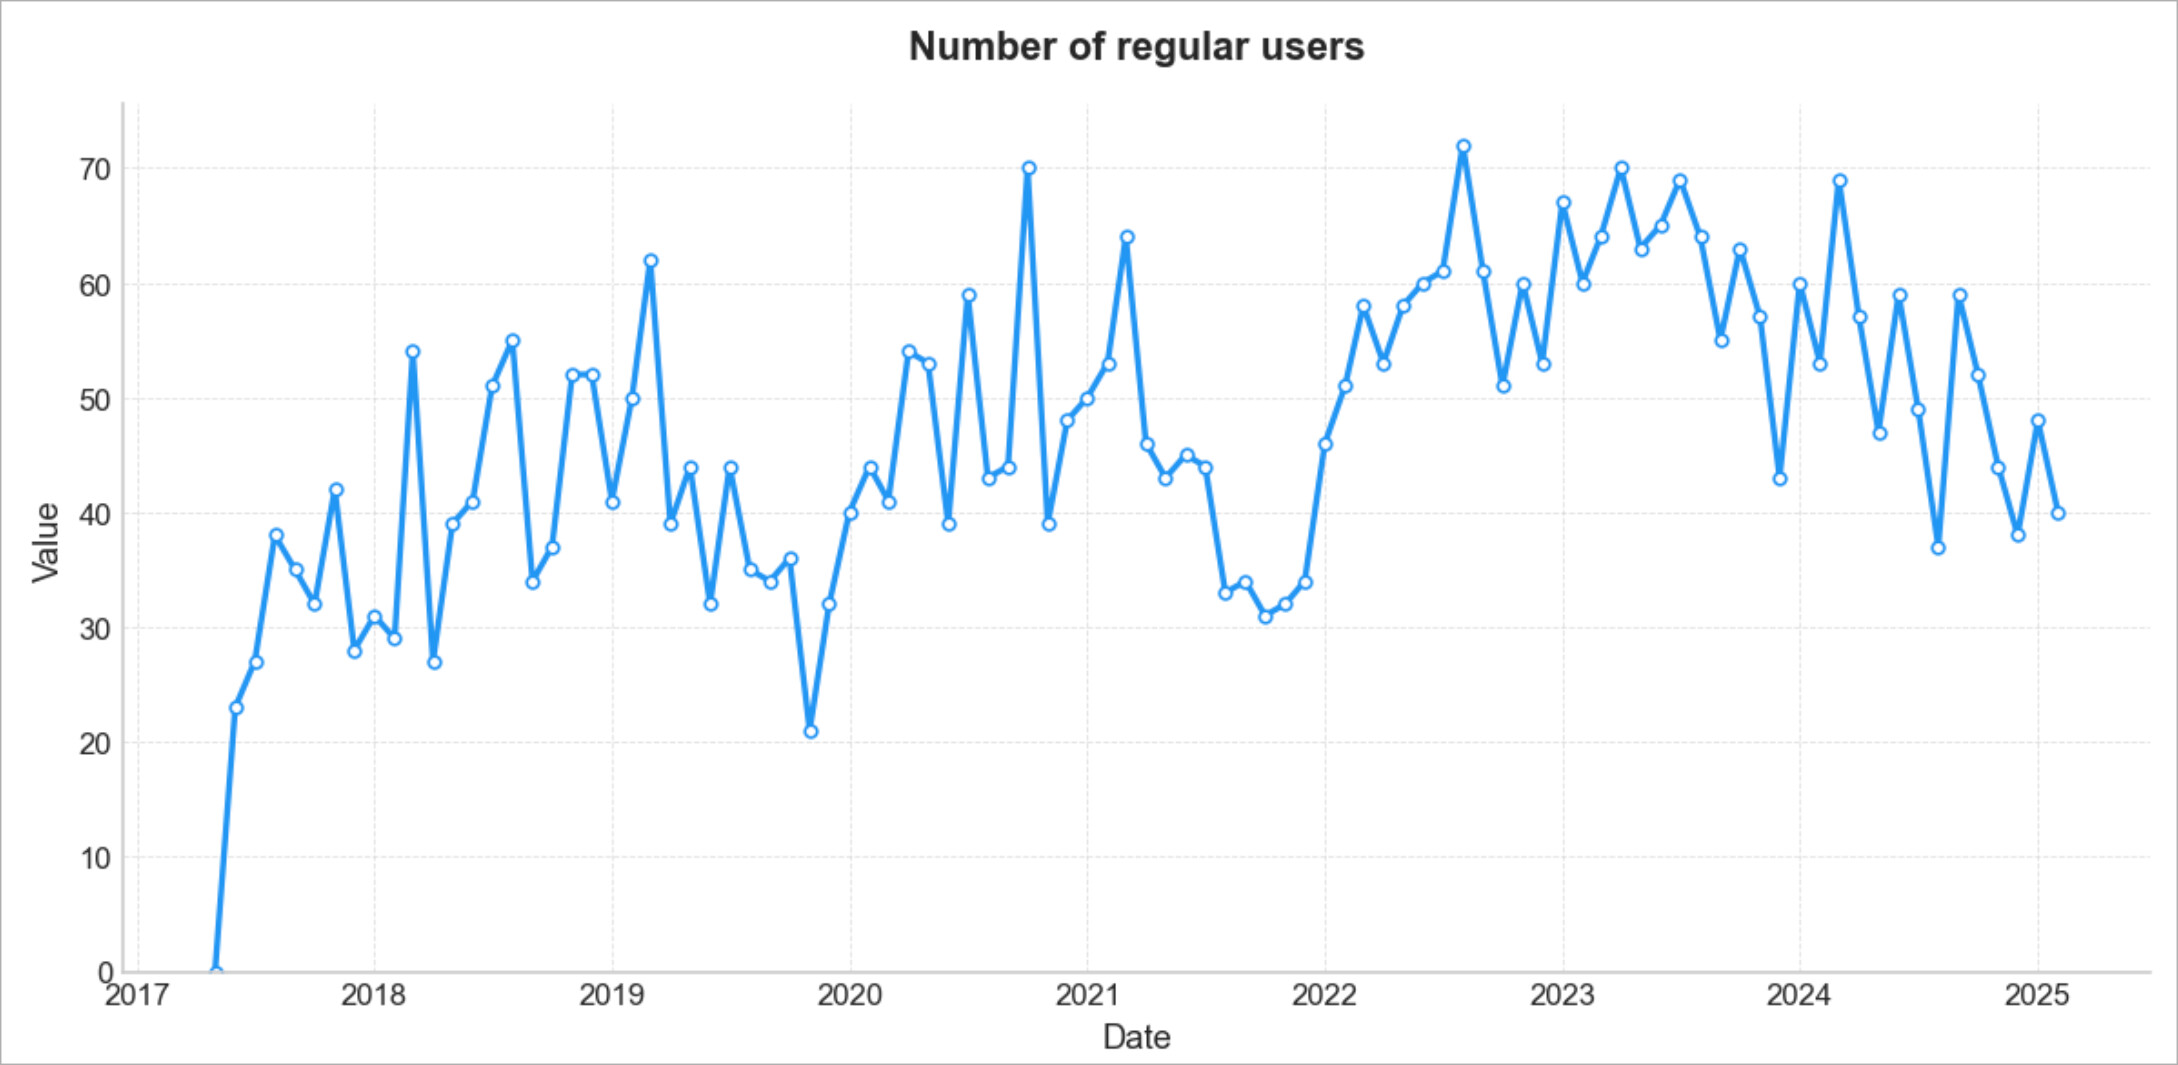
As usual, the more users the better.
Percentage of users in a cohort (out of the total number of active users)
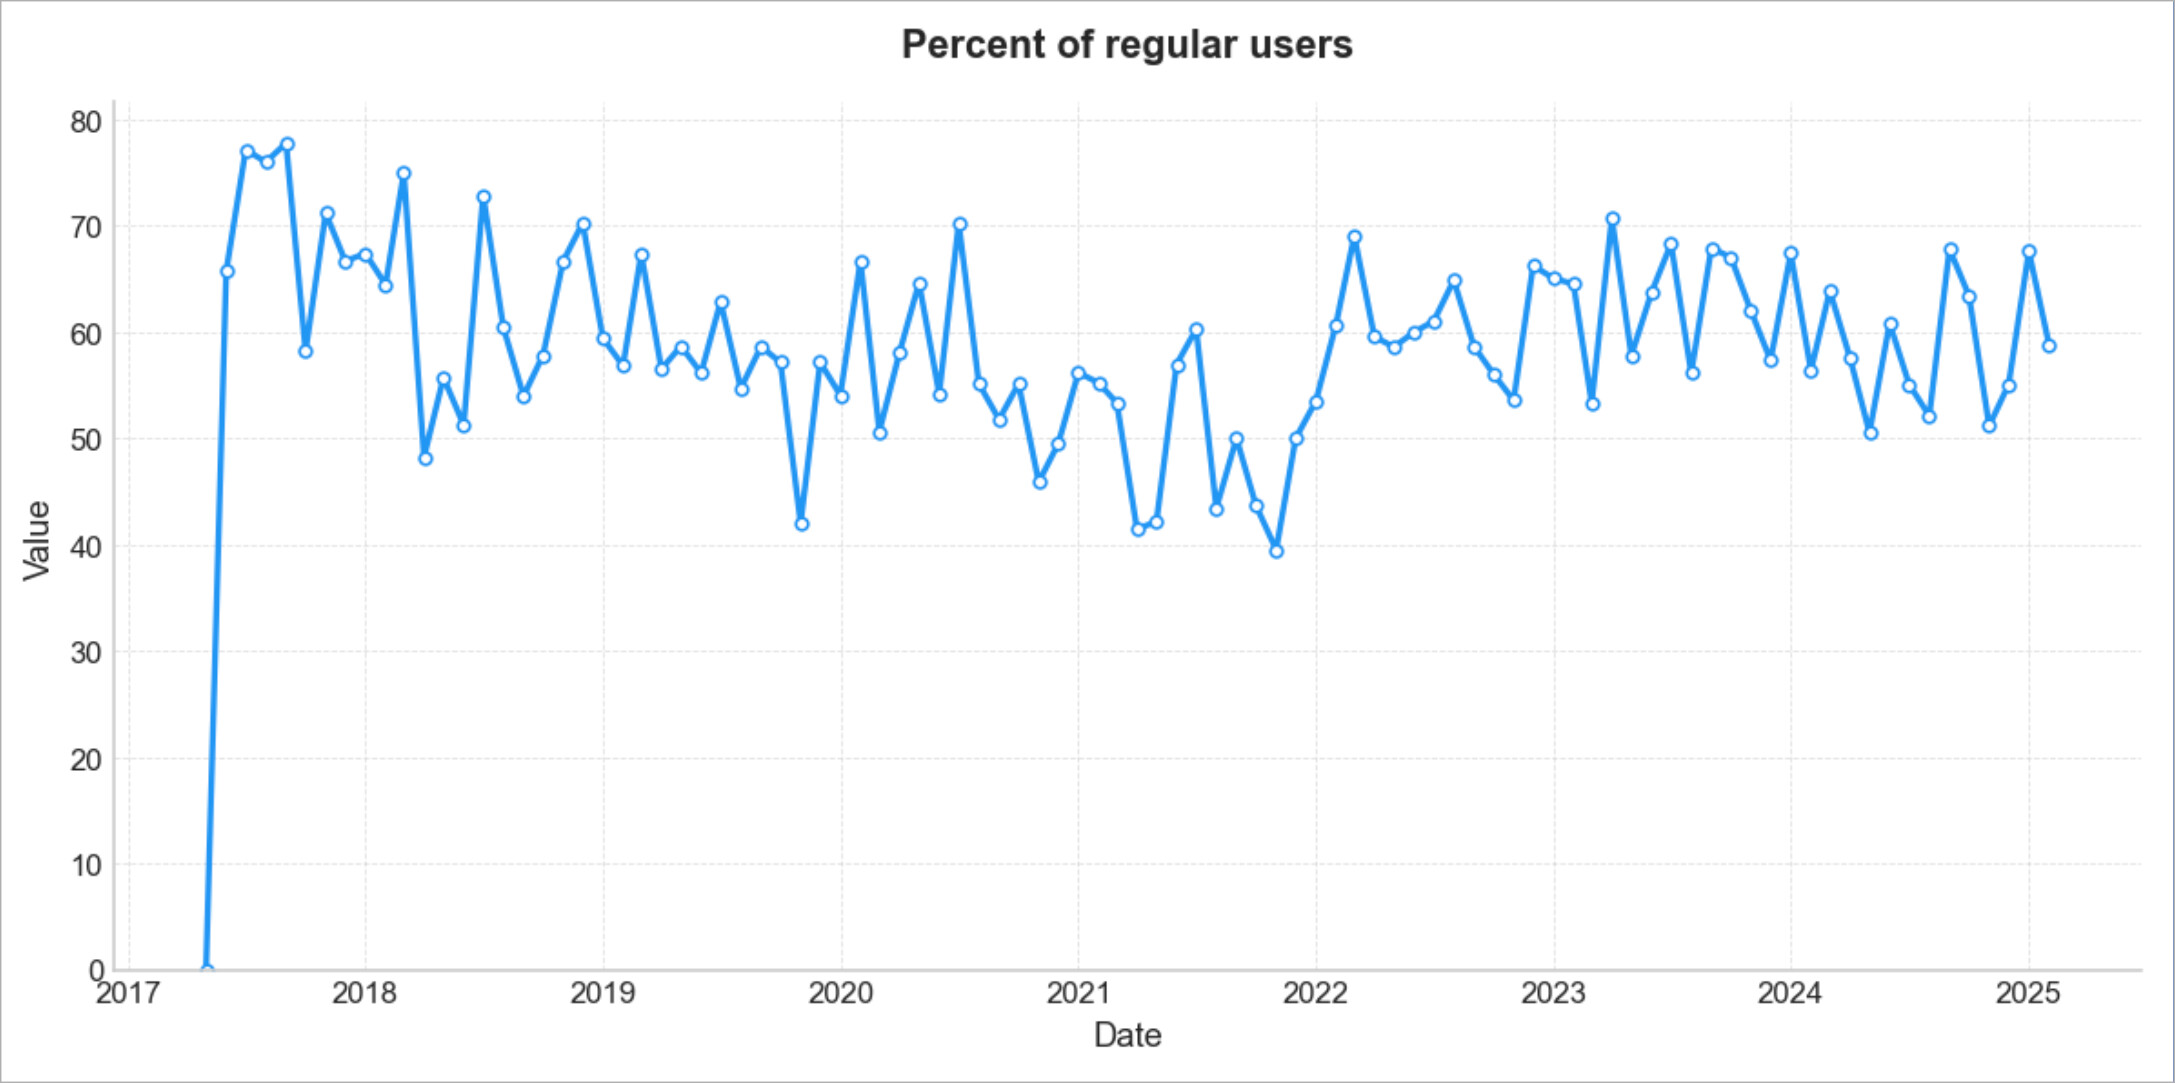
We want this number to increase for the higher cohorts (which will lead to decreasing this measure on the bottom of the funnel ones).
Average number of posts by one user in a cohort
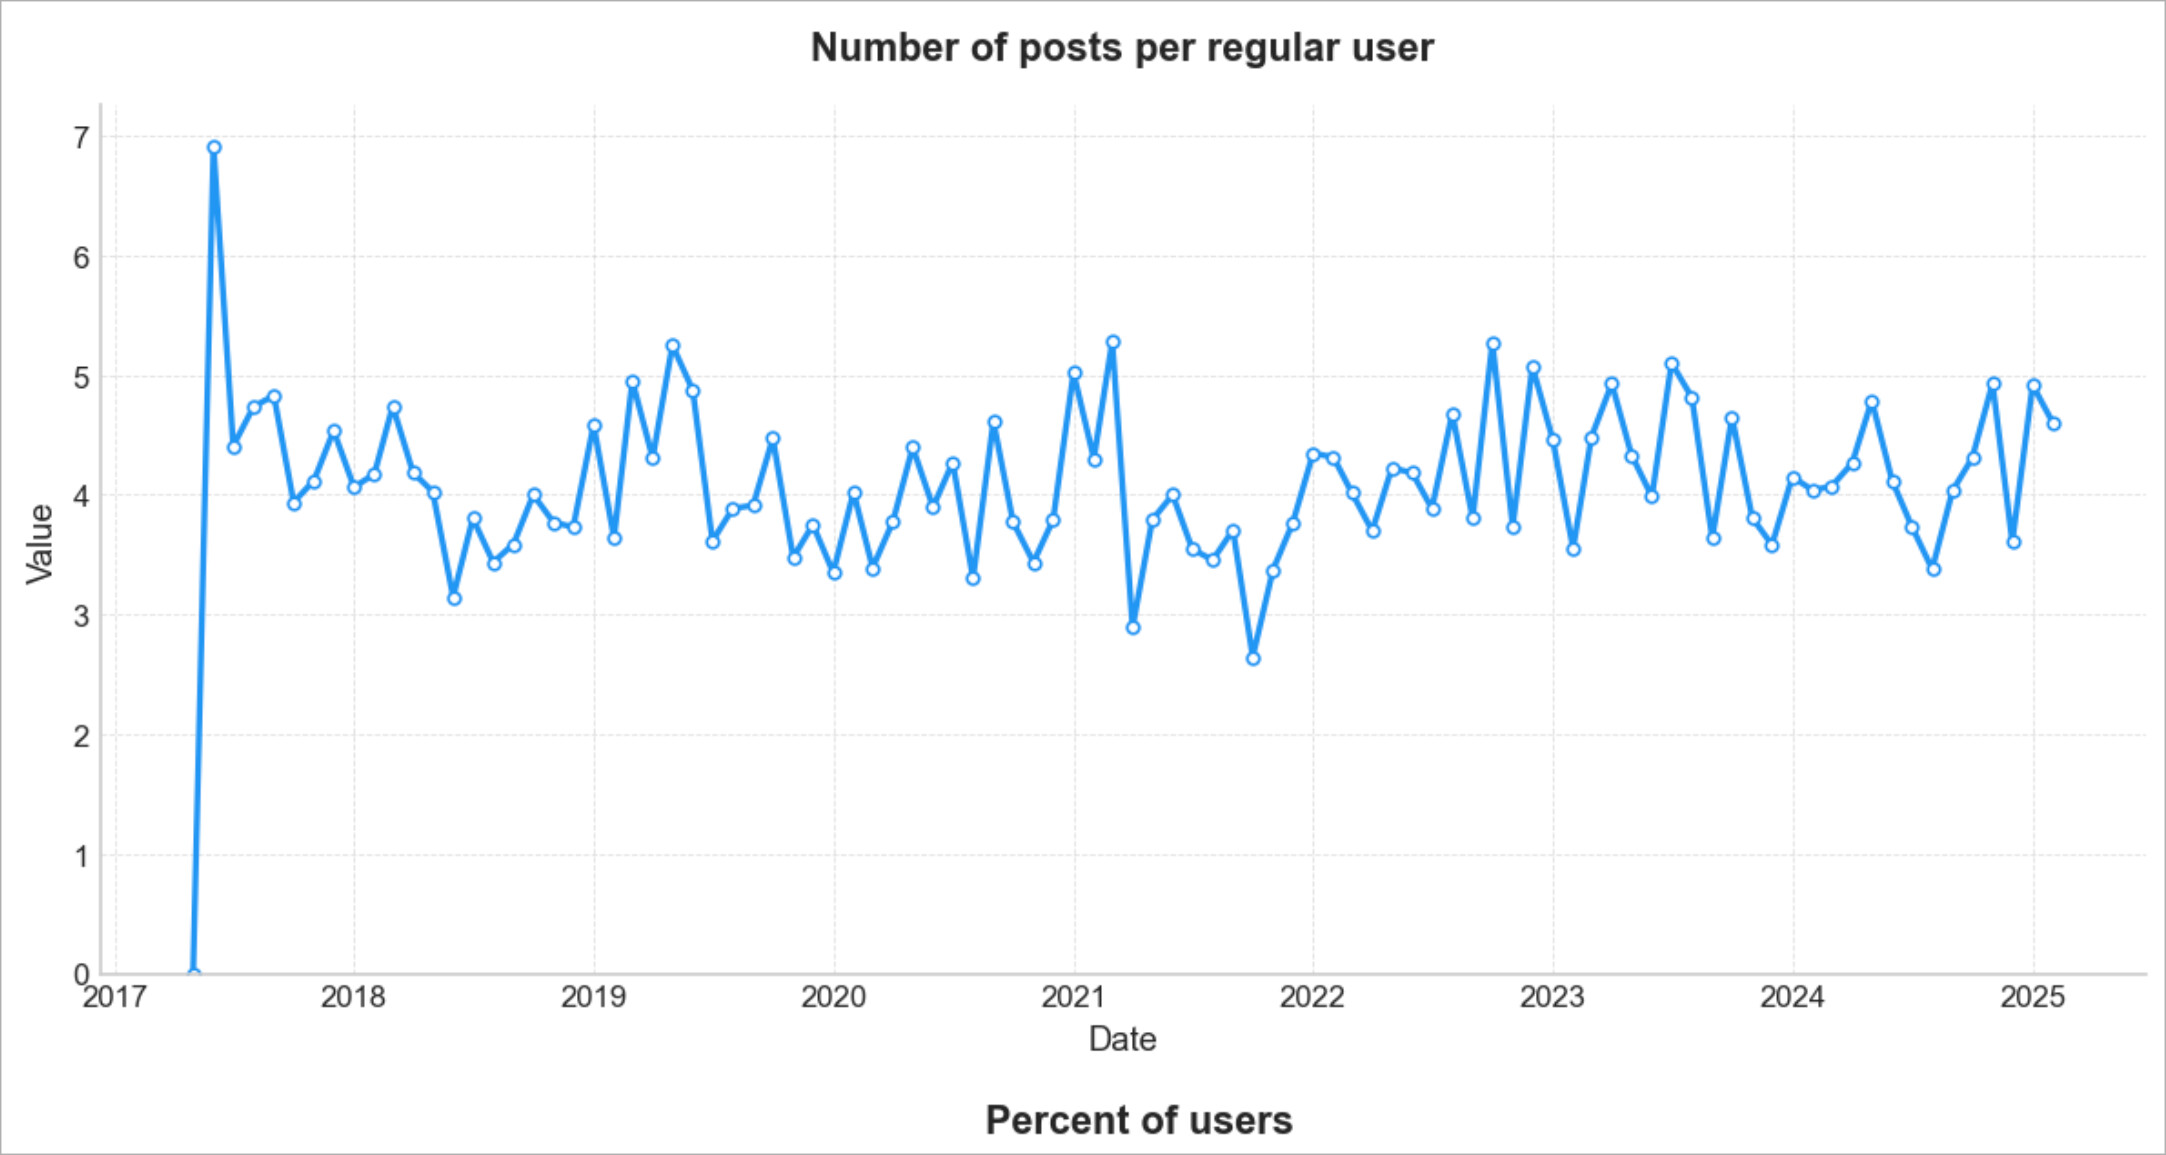
Basically, this metric says “how many posts should a user publish to be in this cohort”. If your community is growing this number will go up but only to some extent (because of the way we split into cohorts.)
Extra: Top of the topic starters funnel
In the measurements above we looked at the community as a monolith. At the same time, there is one special group of users on whom the engagement of the whole community depends a lot. This group is the first time askers. Over the whole history of any community first time askers play a huge role. So it is worth the effort to track the numbers for them each month.
So, back to the measurements. We want to track and report on the following metrics:
- Percentage of users who asked the second question after asking the first one
- Percentage of users who asked the third question after asking the second one
- Percentage of users who asked the fourth question after asking the third one
And up to some serial number of questions you think is important for your community.
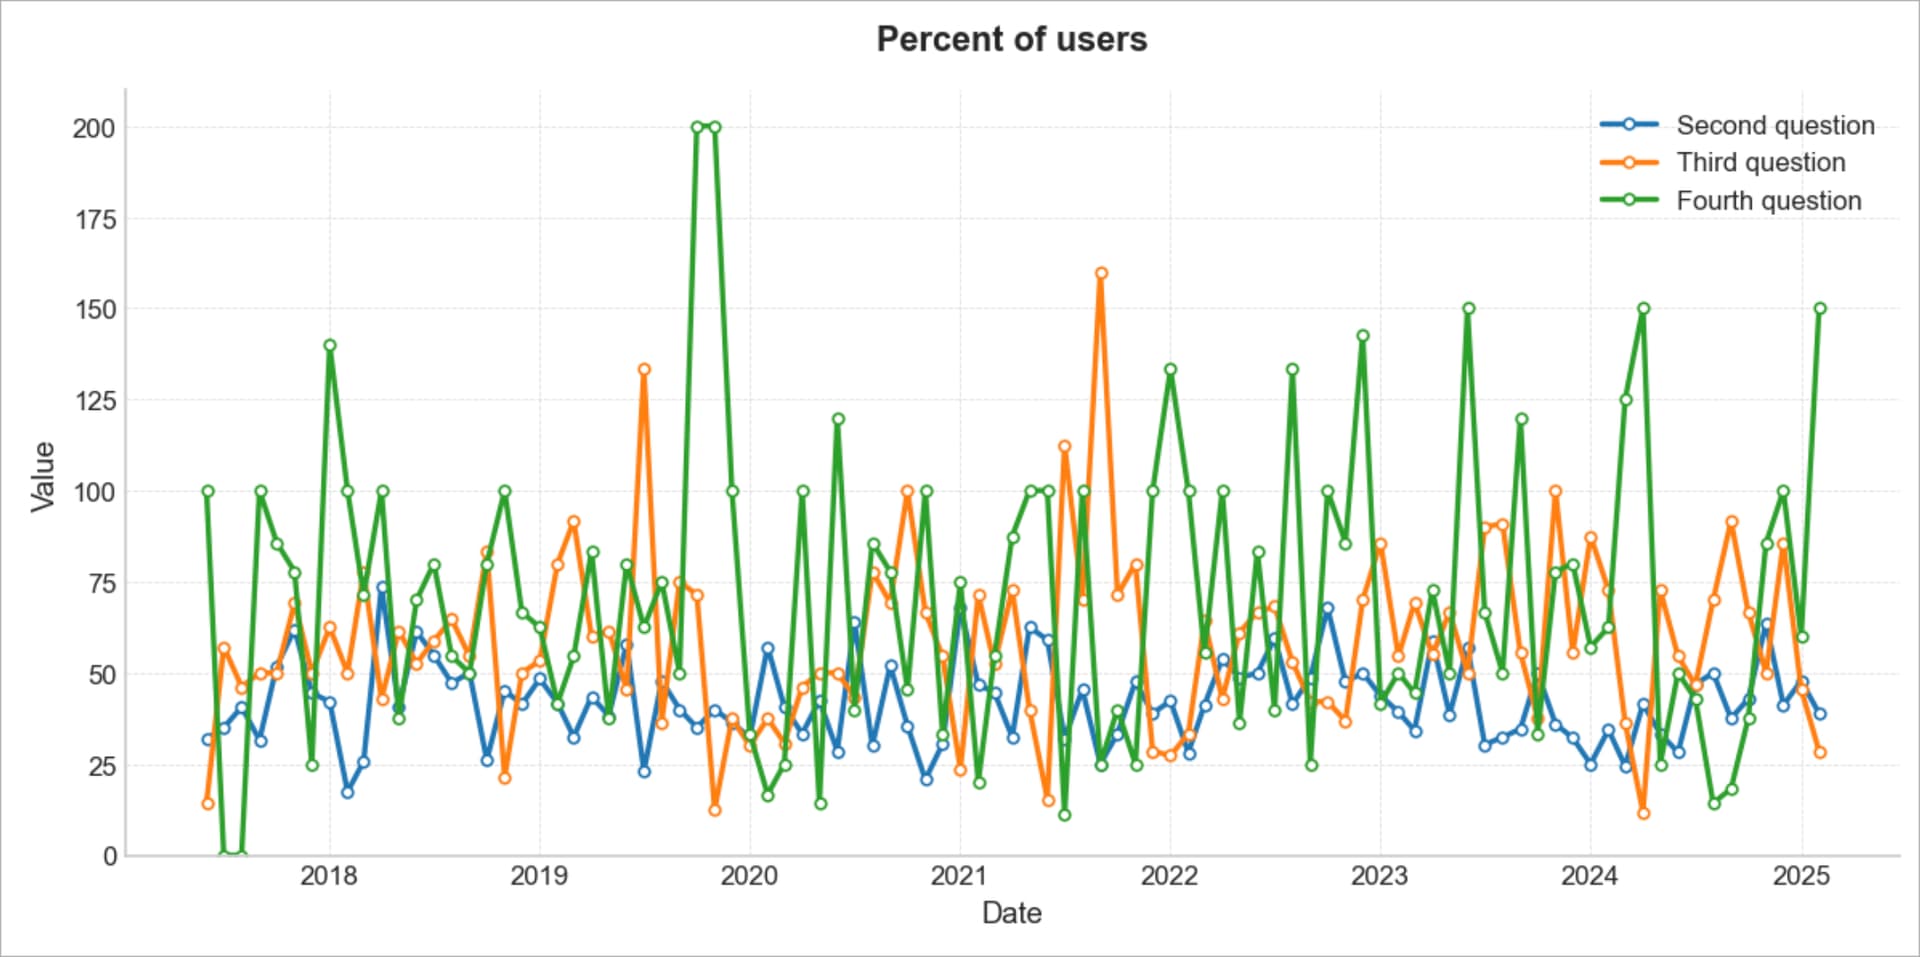
In addition to the chart, for your monthly reports, you can summarize this measurement by the average percentage of transitions to the next question.
I hope this set of metrics can help you report and understand your community engagement clearly and easier.