Is the pace of one kilometer in five minutes okay for running? Well, the answer is… it depends on a lot of factors like if you run a marathon or 1000 meters, you want to recover after a workday or represent your country for an olympic, how old are you etc. Similarly, when we ask whether our community is doing well, we need to consider context. In the app, context can be specified using filters. Filters allow you to slice the data so that the values of a given metric are based on communities that are most similar to yours.
Here are the filters we have at the moment of writing this post.
Community “Subject”
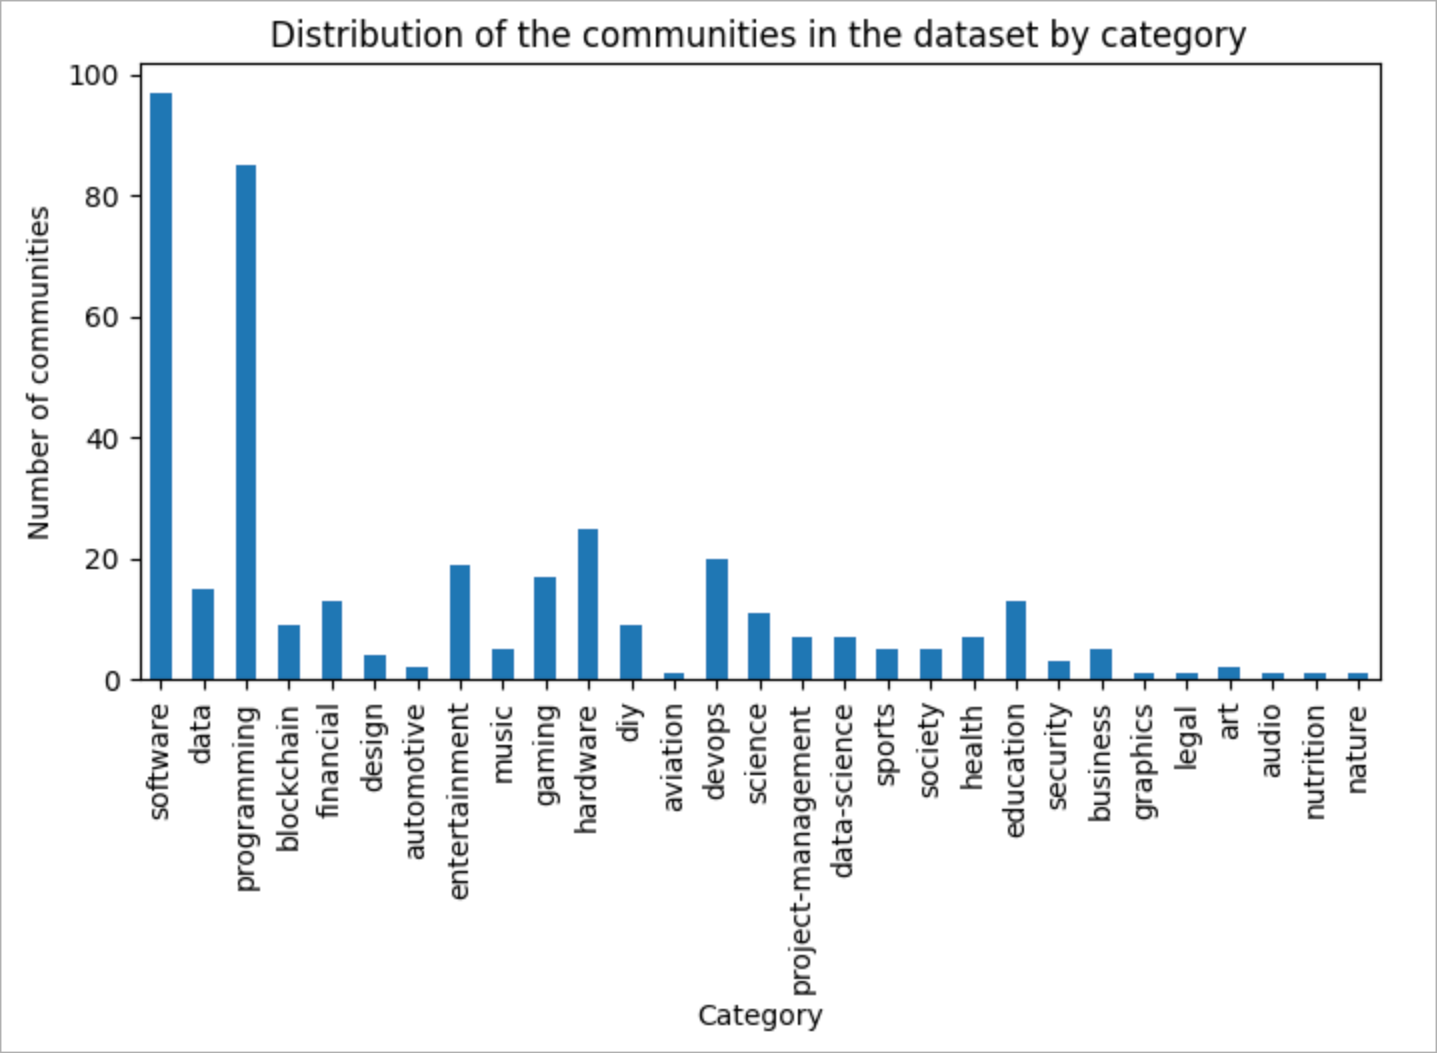
When I was working on the Knowledge Network (a network of Q&A communities, a copy of Stack Exchange but in the Russian language), I quickly realized that the dynamics of growth strongly depend on the subject of a community. MAU in a community of programmers will be higher than in a community of photographers, and all other things being equal, a community for gamers can easily get even higher MAU than a community for programmers.
We manually labeled each community in our dataset with a subject they belong to. Here’s what we got. (Note: a single community can fall into multiple categories.)
Community “Type”
Like the “subject” attribute, the “type” of a community was assigned manually. Although you can find many community types on the Internet, I personally highlight three main ones: support, practice, and discussion.
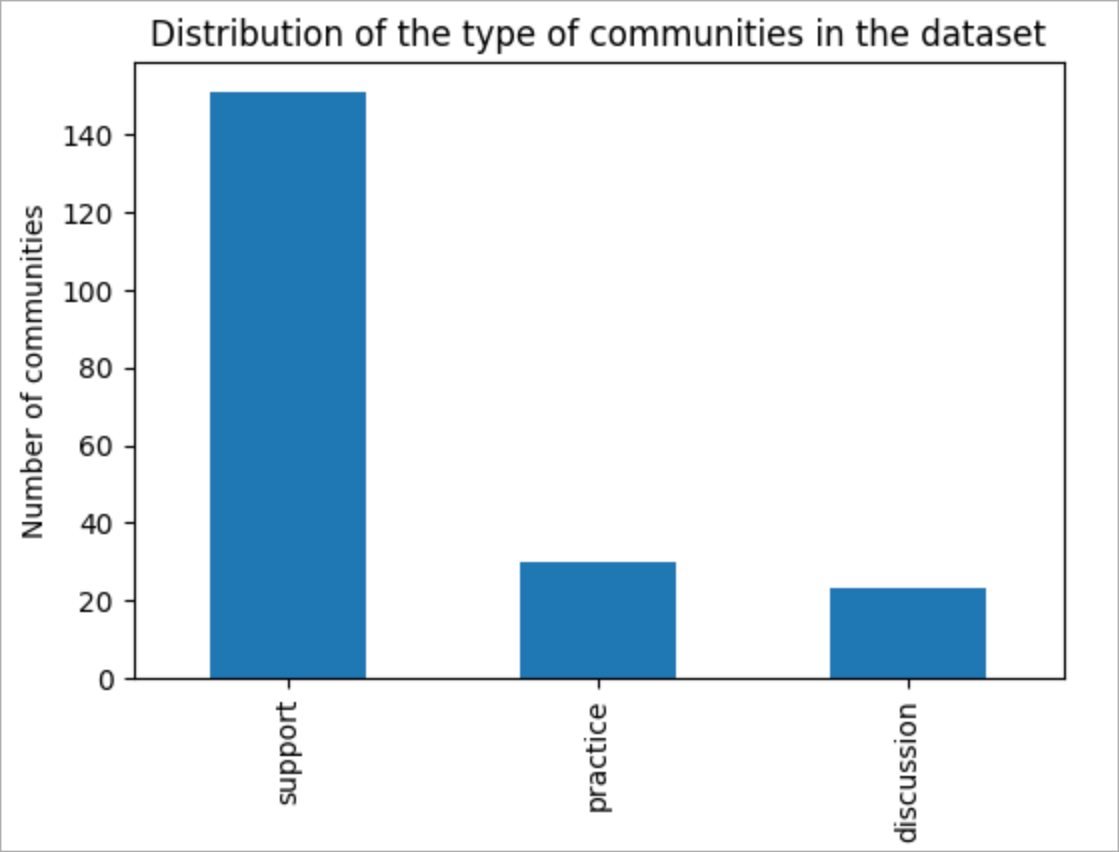
We divided communities as follows. If the main goal of a community is to help users find answers about a specific product, it is a support community. If the main goal is communication for the purpose of communication and leisure, it is a discussion-type community. If people communicate on the forum for the purpose of gaining new knowledge, it is a community of practice.
Community «Size»
We calculate community size on the fly. Community size is the average of the six months with the highest MAU over the entire life of a community.

Based on the distribution above, to filter communities we have identified three groups by activity level:
- Communities with MAU up to 300
- Communities with MAU from 300 up to 1200
- Communities with MAU higher than 1200
Community «Lifetime»
Almost all metrics change with the lifetime of a community. To track this change, each metric in the app has the trend view. At the same time, having the ability to filter communities by lifetime seems necessary, because many quantifiable parameters, such as the number of posts or users, correlate with the lifetime of the community.
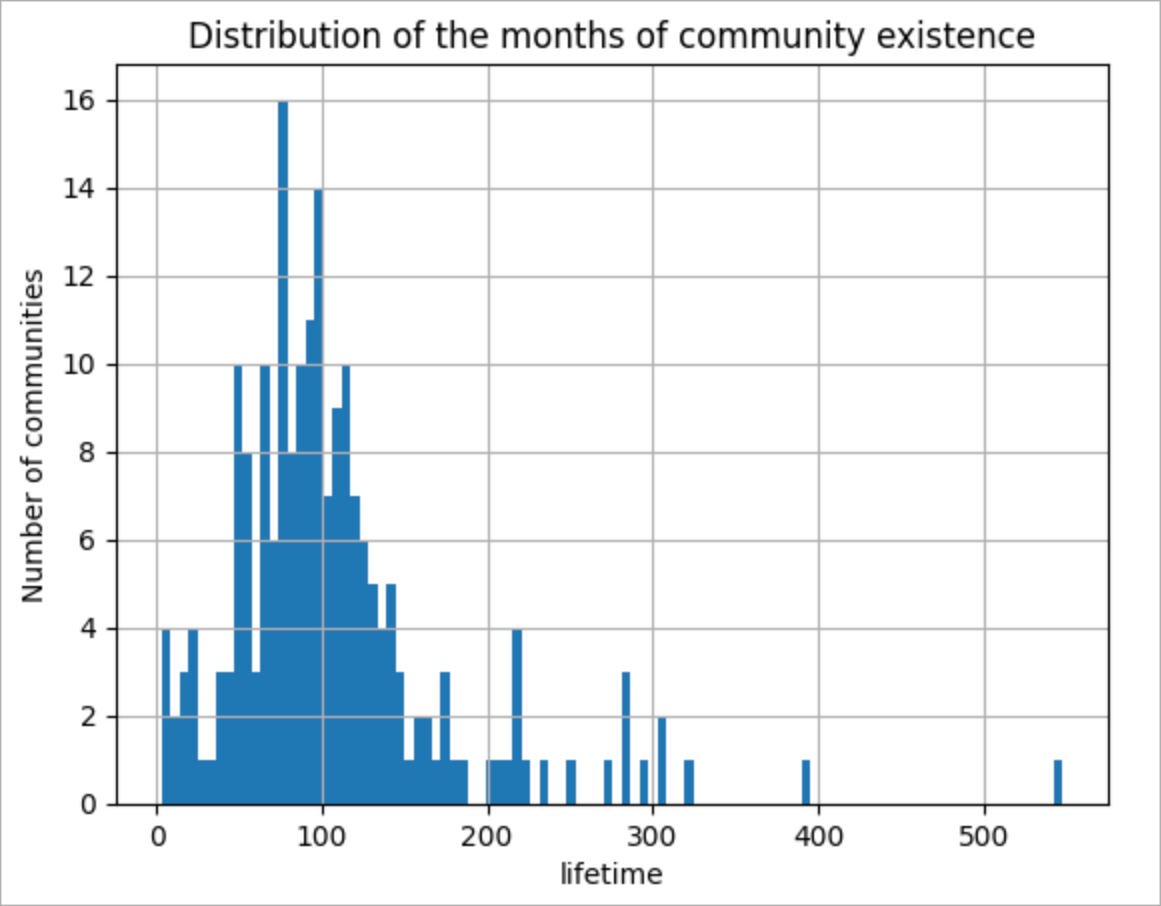
Based on how metrics change over time and the distribution above, we have identified the following groups of communities based on lifetime:
-
Up to 4 years old
-
From 4 years to 10 years old
-
From 10 years to 22 years old
-
22 years old and more
The goal of filters is to help find a sample of communities that are as similar as possible to our community, to improve the accuracy of the metrics assessment. The filters described above seem to be a great start and will help you assess your community initiatives accurately! If you have any comments or would like to add new filters, please tell us about it!