First things first. A cohort is a group of users who share some selected characteristics. Analyzing the behavior of user cohorts is called cohort analysis. When you did analysis of users who registered in different months or users with different reputations, you were doing cohort analysis.
In my experience, there are two most important use cases for cohort analysis in online communities. (1) Analyzing the impact of [social and product] initiatives and (2) Assessing the health of the community. In both cases, to conduct the analysis, we need to break down all users into groups based on their engagement level. This is where many community managers start to run into troubles…
How many levels of engagement are there? What criteria should be used to break the users into the levels? What period of activity to use (day, month or year?) What boundaries should be used for the split?
Unfortunately, at the time of writing, I haven’t seen any articles that answer any of these questions. Though I touched on these questions briefly in my book, I would like to talk about engagement cohorts and thresholds in a little more detail now.
Let’s get started! ![]()
What period of activity should be used for a split?
The rule of thumb to select the period is to choose such a period that users will have the opportunity to prove themselves.
For example, a period of one day will not be enough because an engaged user who posts hundreds of times over the course of a year and a user who posts only once may look identical within a single day. On the other hand, with a year’s worth of data, you can easily separate regular users from one-time posters. However, you probably don’t want to wait a year to conduct your analysis.
In other words, we need to choose a period of time that is sufficient to separate one type of user from another. I usually use a period of one month. 30 days is enough for user activity to differ by several orders of magnitude. At the same time, a month is a standard reporting period, and a lag of 30 days will suit most of the decision makers.
What criterion to use to separate users?
You can use any criteria that represents an activity that is of primary importance to your community. In many communities, the most important component is content. So a good starting point for them is the number of posts, comments, or other content items created.
What levels of user engagement exist?
In general, the number of engagement levels depends on the period you choose for analysis. The longer the period you choose, the more activity levels you can find. For a period of one month, I think it makes sense to highlight five engagement levels.
- Active users. Users who have created only one post in the entire period of interest. These are people who accidentally came across your community and found it worthwhile to dedicate their time to creating a post.
- Regular users. Casual users who visit and post in your community once or twice a week. These are people who like your community and participate in it consciously.
- Engaged users. These are users who consider your community an important part of their lives. Usually, they post something if not every day, then every other day.
- Core users. Users for whom participating in your community is an important daily routine. Typically, such people create a few posts every single day.
- Super users. Super engaged users who spend almost their entire day in the community.
Important observations:
- The number of engagement levels reflects the size of a community. No one will spend all day in a community where there are no other users.
- As a result, not all communities have users on all engagement levels. In order for a community to have core users, it needs to be around for some time.
- So, in general, the levels are dependent. Without active users, the chances of having core users in a community are extremely low.
What splitting thresholds to use?
There are no industry wide predefined thresholds for each engagement level (well, as the levels themselves!) But! We can try to find them ourselves. One important note here. Please note that we want to identify user cohorts whose behavior might differ, not just sort users by activity level. Therefore, finding thresholds is important to consider in the context of the answers to the previous questions about the length of the period and the number of engagement levels you want to find.
I distinguish three main approaches to finding the boundaries: expert opinion, extreme value detection, and machine learning. Let’s look at each of them.
The Sanity Check
When I was doing cohort analysis in the past, I noticed that a good partition into engagement levels has the following characteristics:
- The total number of posts created by each cohort during the selected period should not differ by more than 10 times from the other cohorts.
- At the same time, the number of users in each group should differ by at least several times (or even an order of magnitude!), i.e. the number of users decreases with increasing level of their engagement.
These two properties will help us evaluate approaches to partitioning.
Identifying engagement levels based on expert opinion
Let’s try to pick boundaries for each group based on its description.
- Active users. It’s simple, these are users with one post per definition.
- Regular users. The size of this group can be from 2 to 6 posts per month (i.e. 4 weeks per month, one post per week, sometimes two).
- Engaged users. I would define users of this group as ones who create from 7 to 15 posts per month (i.e. they post every other day).
- Core users. From 15 to 40 posts per month (i.e. post every day, but not spend the entire day in the community).
- Super users. All users who create more than 40 posts per day.
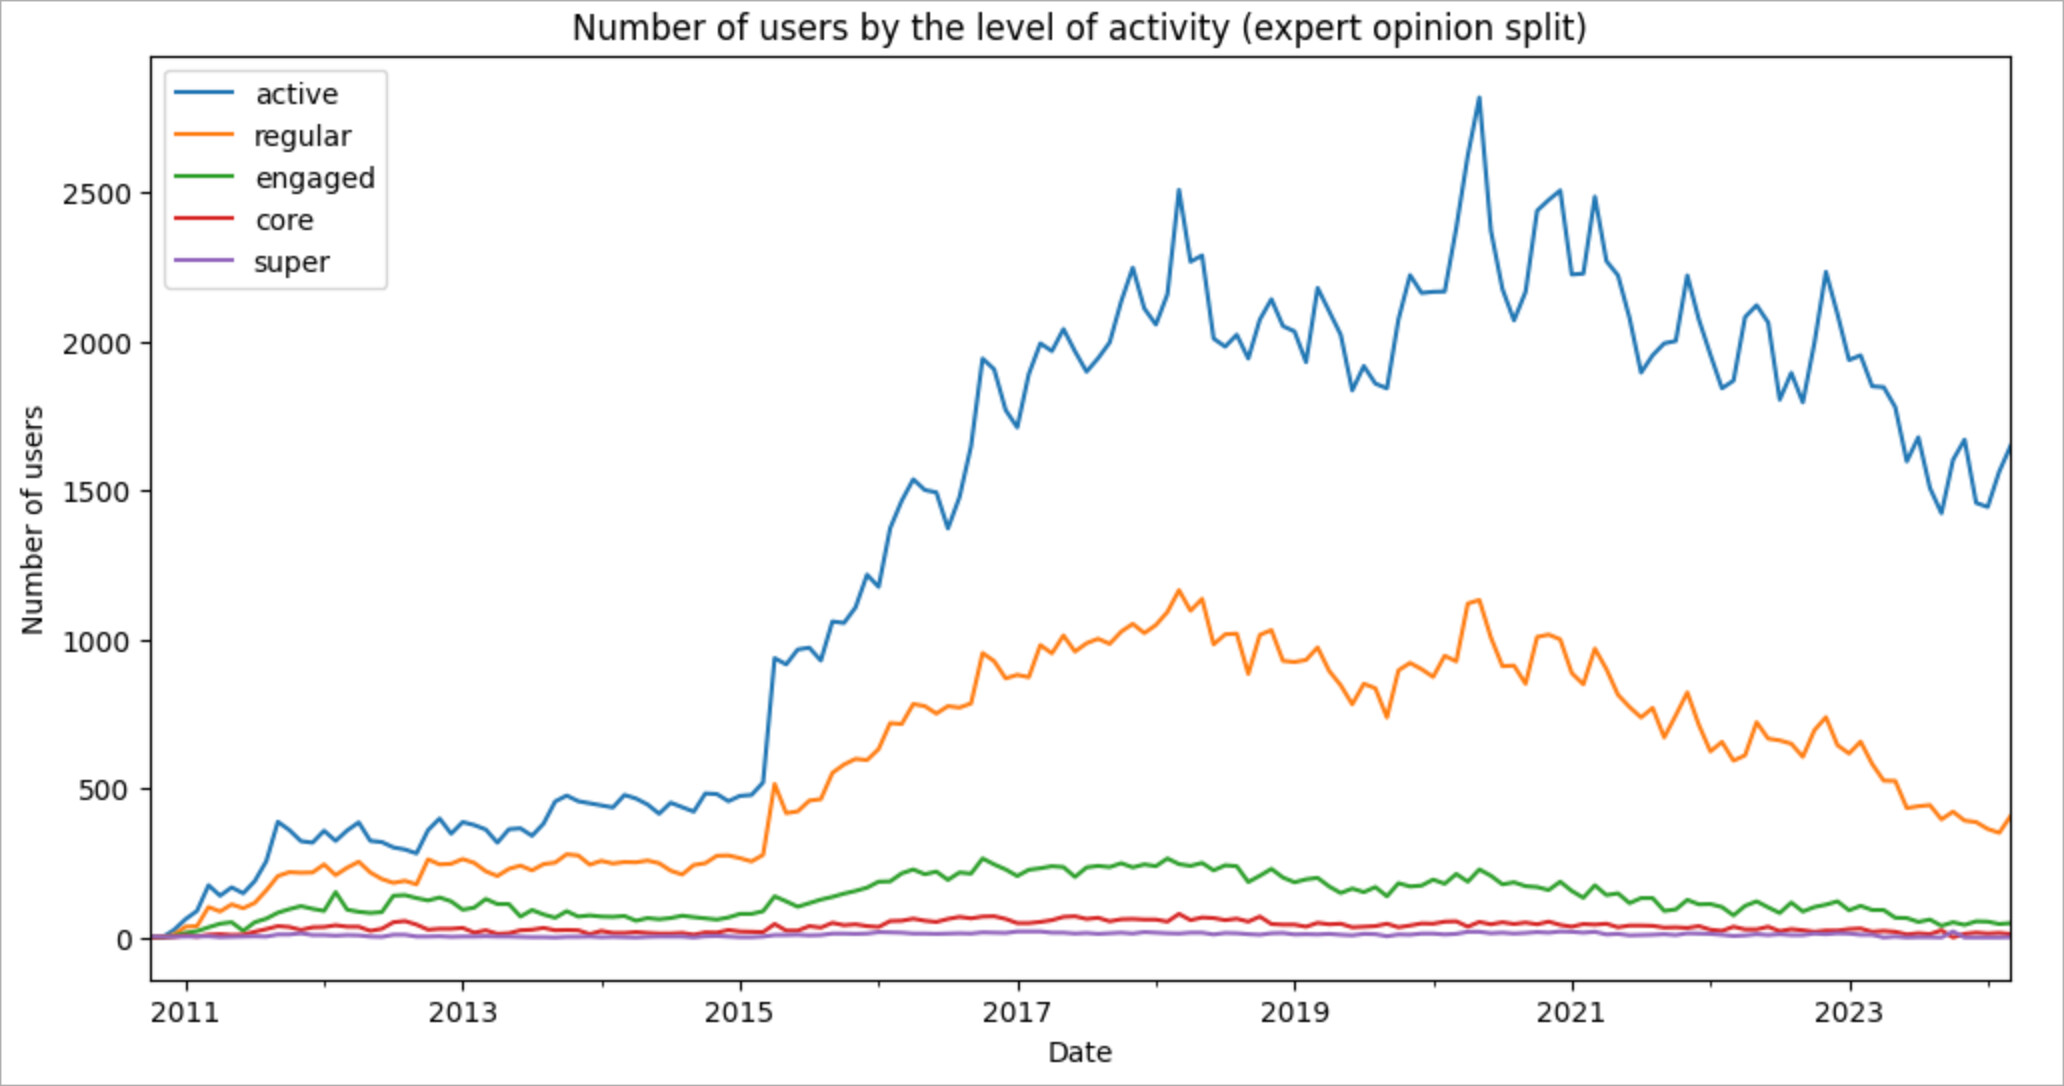
To see what we got with these boundaries, let’s see what the split will look like on the Stack Overflow in Russian data. We will look at two charts (our sanity check!): the number of users in each cohort
And the total number of posts created by the cohort for the selected period
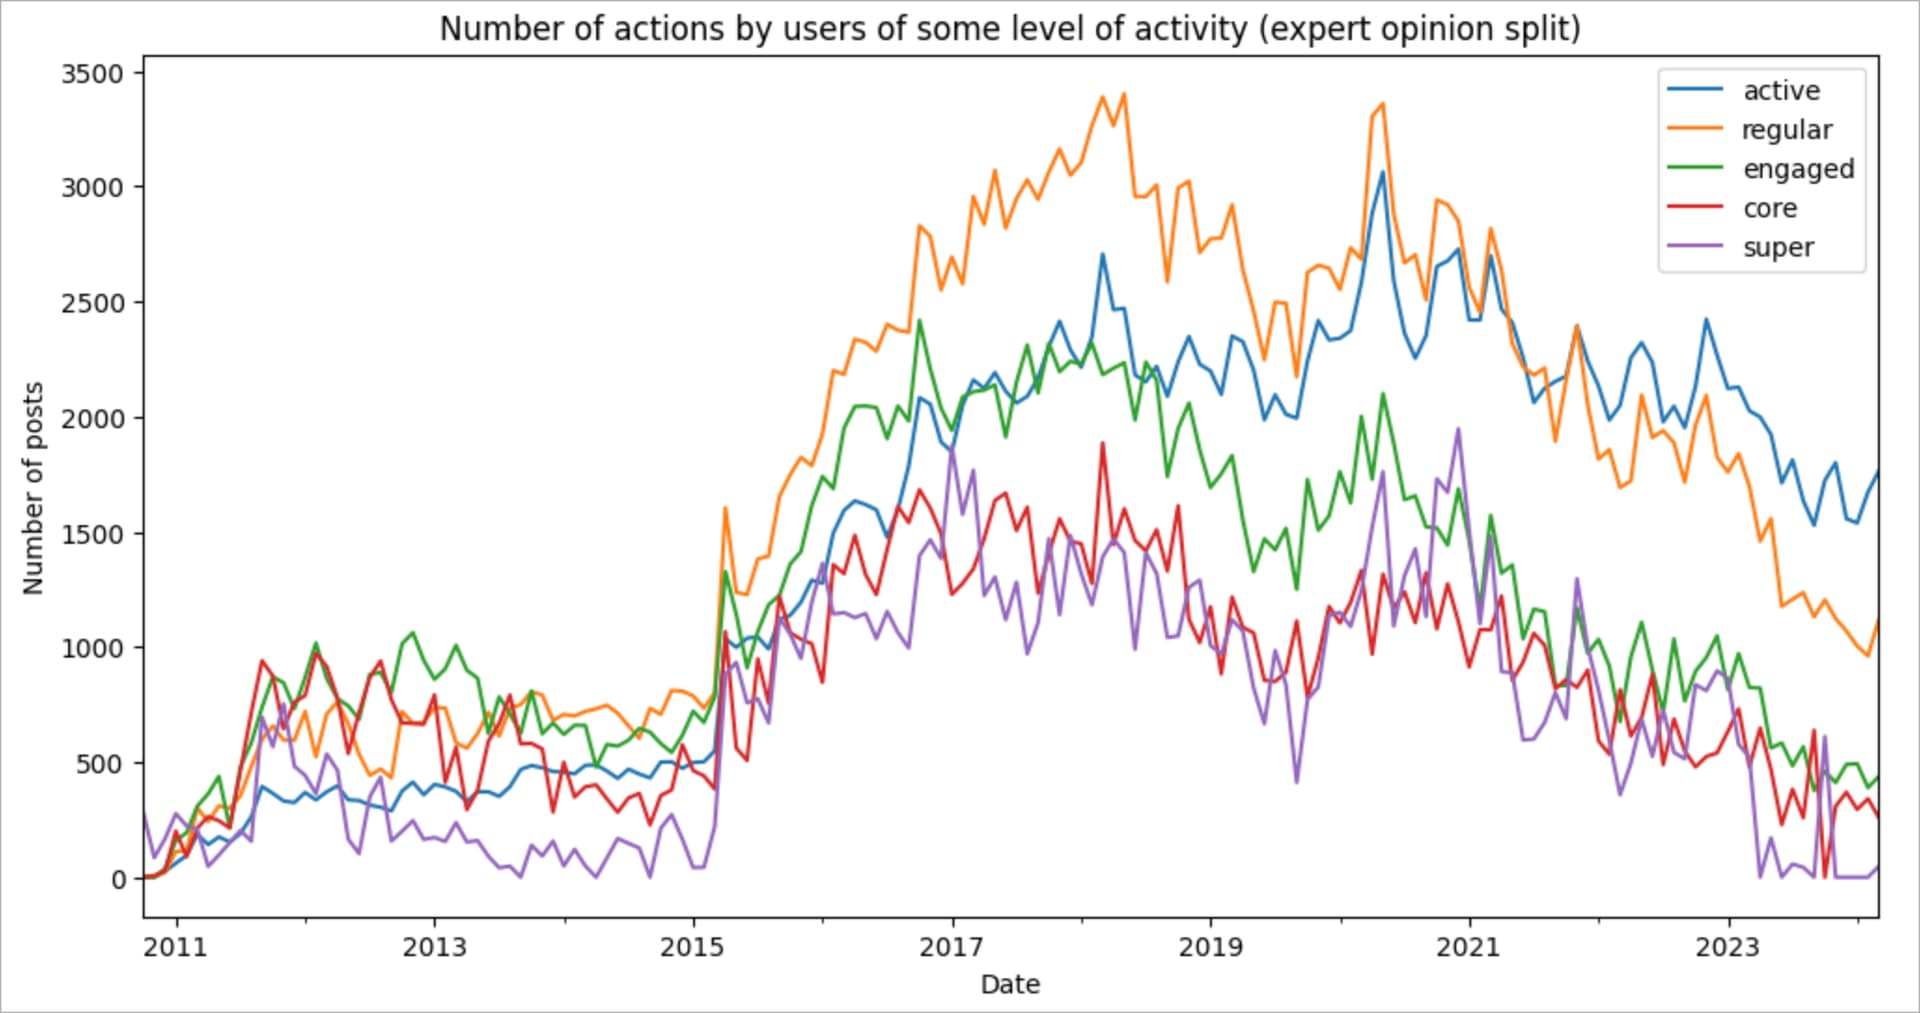
Hooray! Our split is surprisingly good! The number of users in each category decreases by an order of magnitude but the total number of the posts created by each group is similar. At the same time, this approach has its downsides. The main one is the strict predefined thresholds, which may not fully reflect the real state of affairs in communities of different sizes.
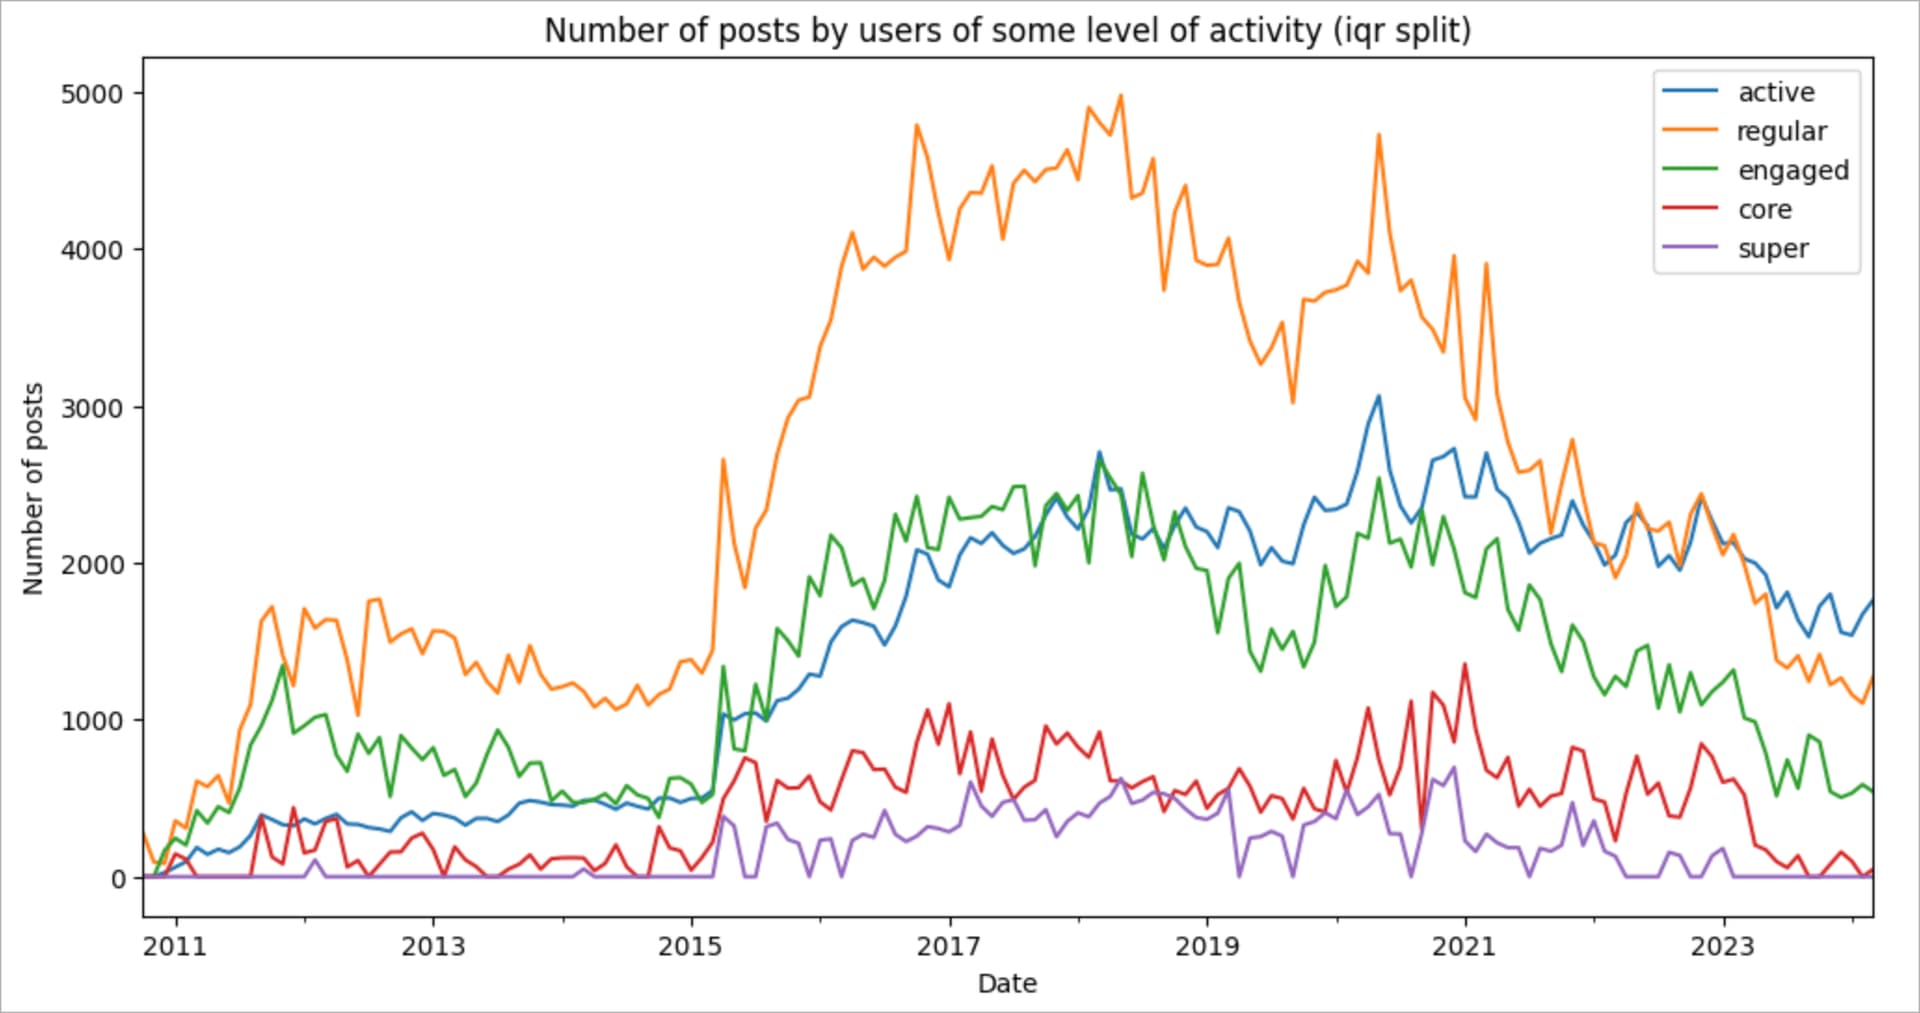
Identifying engagement levels based on big difference in activity
This approach is based on the fact that in data analysis we can consider an object as a “deviation” if it is further than one and a half interquartile ranges from the 75% quantile of the distribution. To put it more simply, we calculate the average number of posts among all users and see which users have much more posts than all users on average, then we select these users into a dedicated group and do the same procedure for this group: we calculate the average, find users who have many more posts than others, select them into a group, and so on until there are no more users left. Each of these groups is an engagement level.
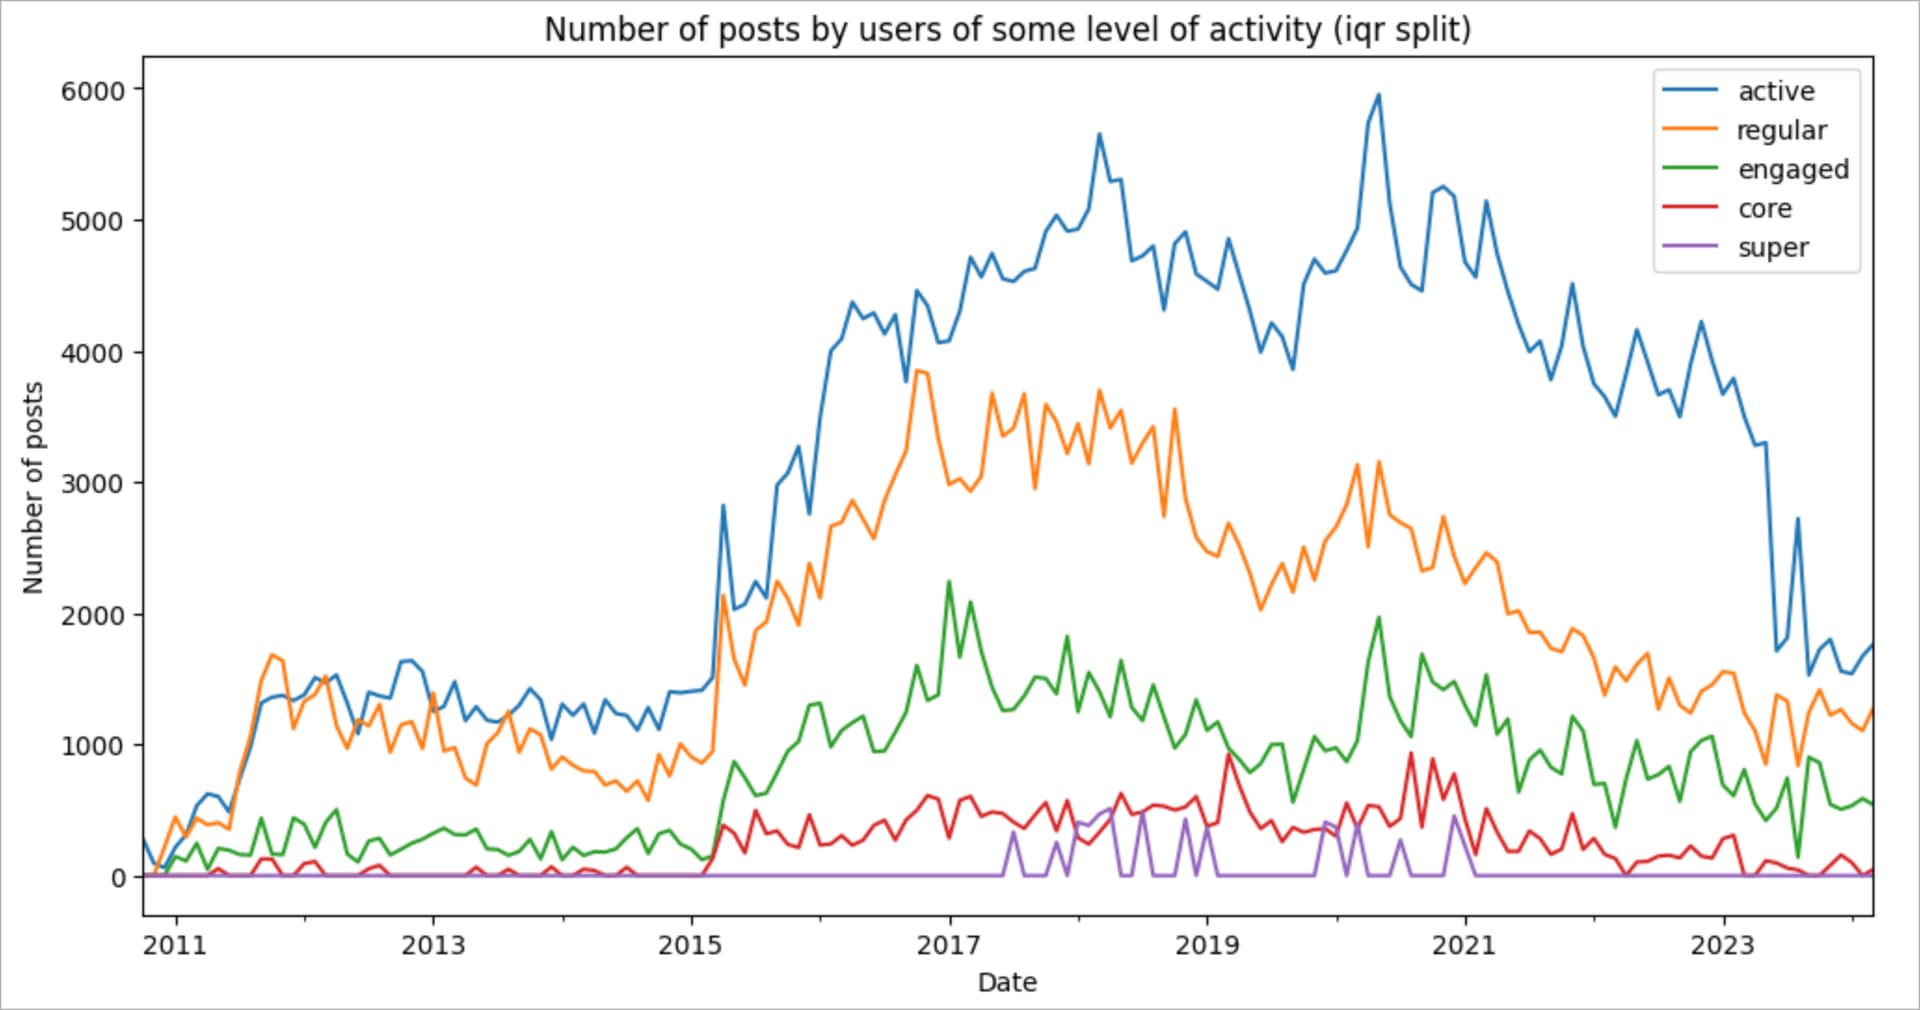
Here is what I got by running this algorithm on Stack Overflow in Russian data.
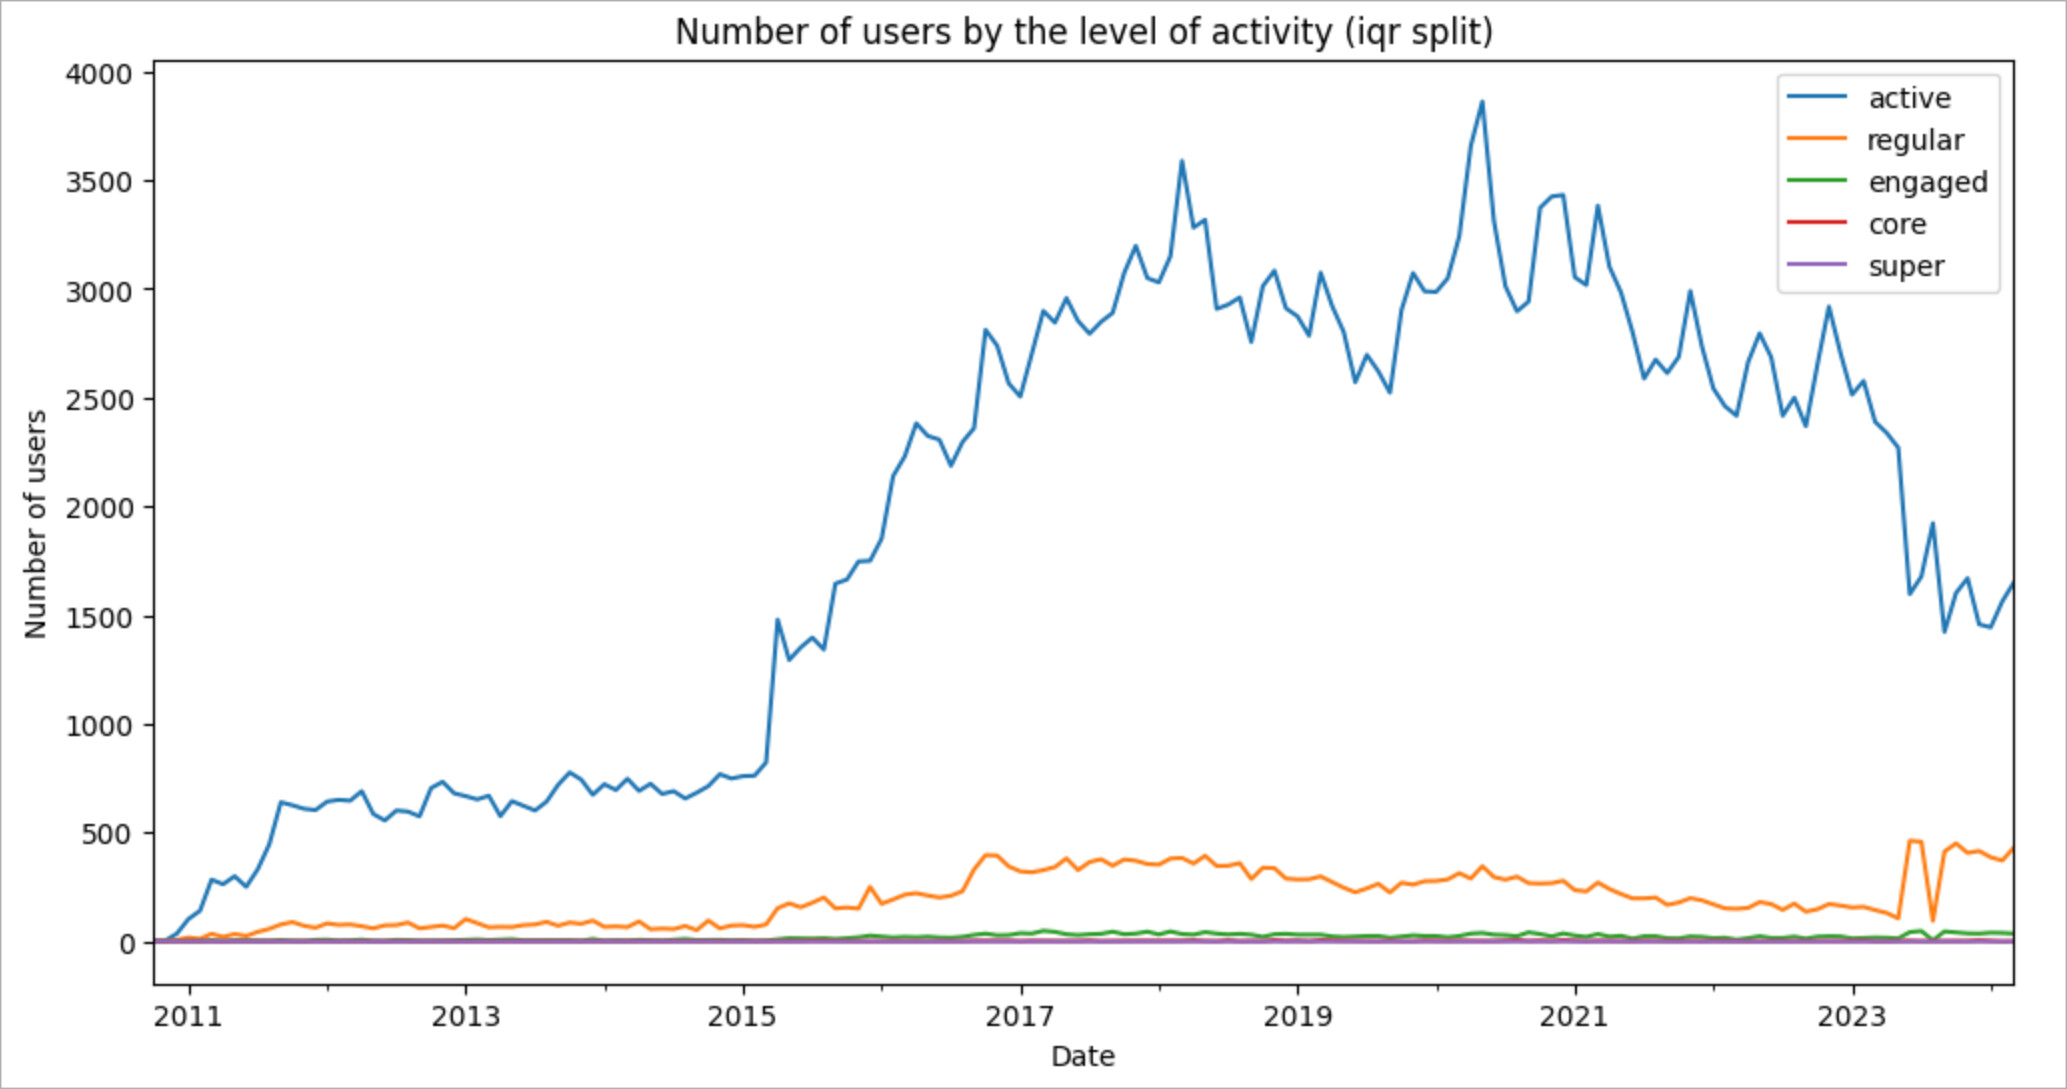
The numbers:
- Active users. 1 - 5 posts
- Regular users. 2- 30 posts
- Engaged users. 8 - 90 posts
- Core users. 30 - 350 posts
- Super users. 200 or more posts.
Looking at the breakdown, we can see that
- The boundaries overlap. Since the boundary value is calculated each month based on the available data, we get a series of threshold values (value distribution).
- Each subsequent cohort of users is only about ten percent of the previous one in terms of the number of users, which is not good.
- The cohort of active users and their contribution turned out to be disproportionately large.
Definitely, some things are wrong here. To start, obviously, a user who posted only once will have a completely different engagement than a person who participated in five discussions so those users should not be in the same group. Let’s try to limit the upper bound for the active users at 1 post, and see what happens.
Well, now the breakdown has become similar to what we expected to see!
- Active users. 1 post
- Regular users. 2- 12 posts
- Engaged users. 8 - 50 posts
- Core users. 20 - 150 posts
- Super users. 100 or more posts
Good breakdown but still not as good as the breakdown based on the expert opinion. Let’s see if we can improve it by utilizing some simple machine learning algorithms.
Identifying engagement levels based with machine learning algorithms
While working at Stack Overflow, I have done splitting based on interquartile range many times and seeing the same numbers for different communities, I came to the boundaries that we saw in the expert option section. At the same time, the idea of automatic splitting seemed more correct to me because even in different Stack Exchange communities, the optimal boundaries are slightly different for each community. One way to solve this problem is to use machine learning algorithms. The simplest of them is K-Means.
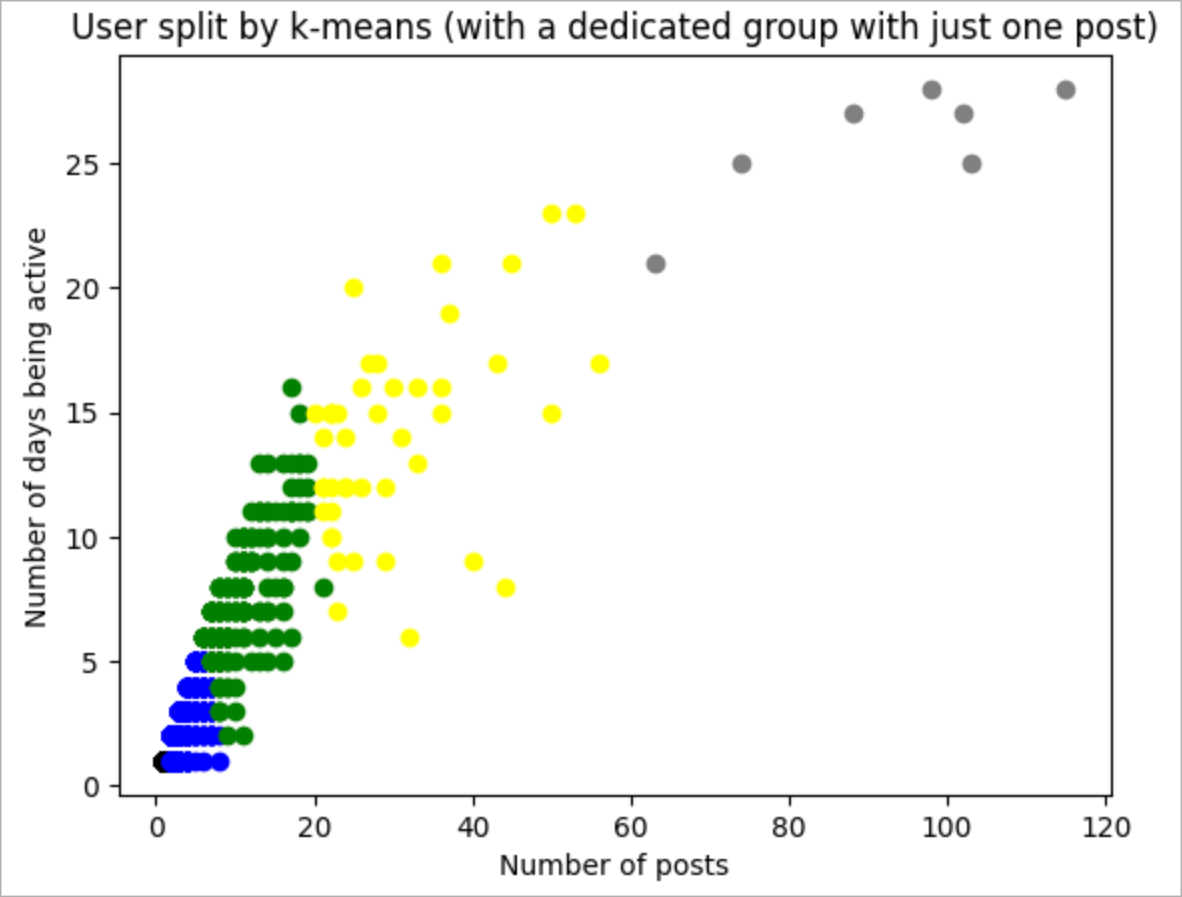
The idea of the K-Means algorithm is that it automatically creates a division of all available users into the most similar groups. Our task is only to set the number of groups. In addition, in the case of using K-Means, we can use not only the number of posts as the dividing factor, but also the number of days of activity (or any other set of attributes!) So, again, the only nuance of utilizing the algorithm is that we are required to set the number of groups before creating the breakdown. To make this approach adjustable for communities of different sizes, we will do this using the interquartile range plus fixing the boundary for the active users cohort at 1 post for the better split. Let’s see what the cohorts look like on Stack Overflow in Russian.
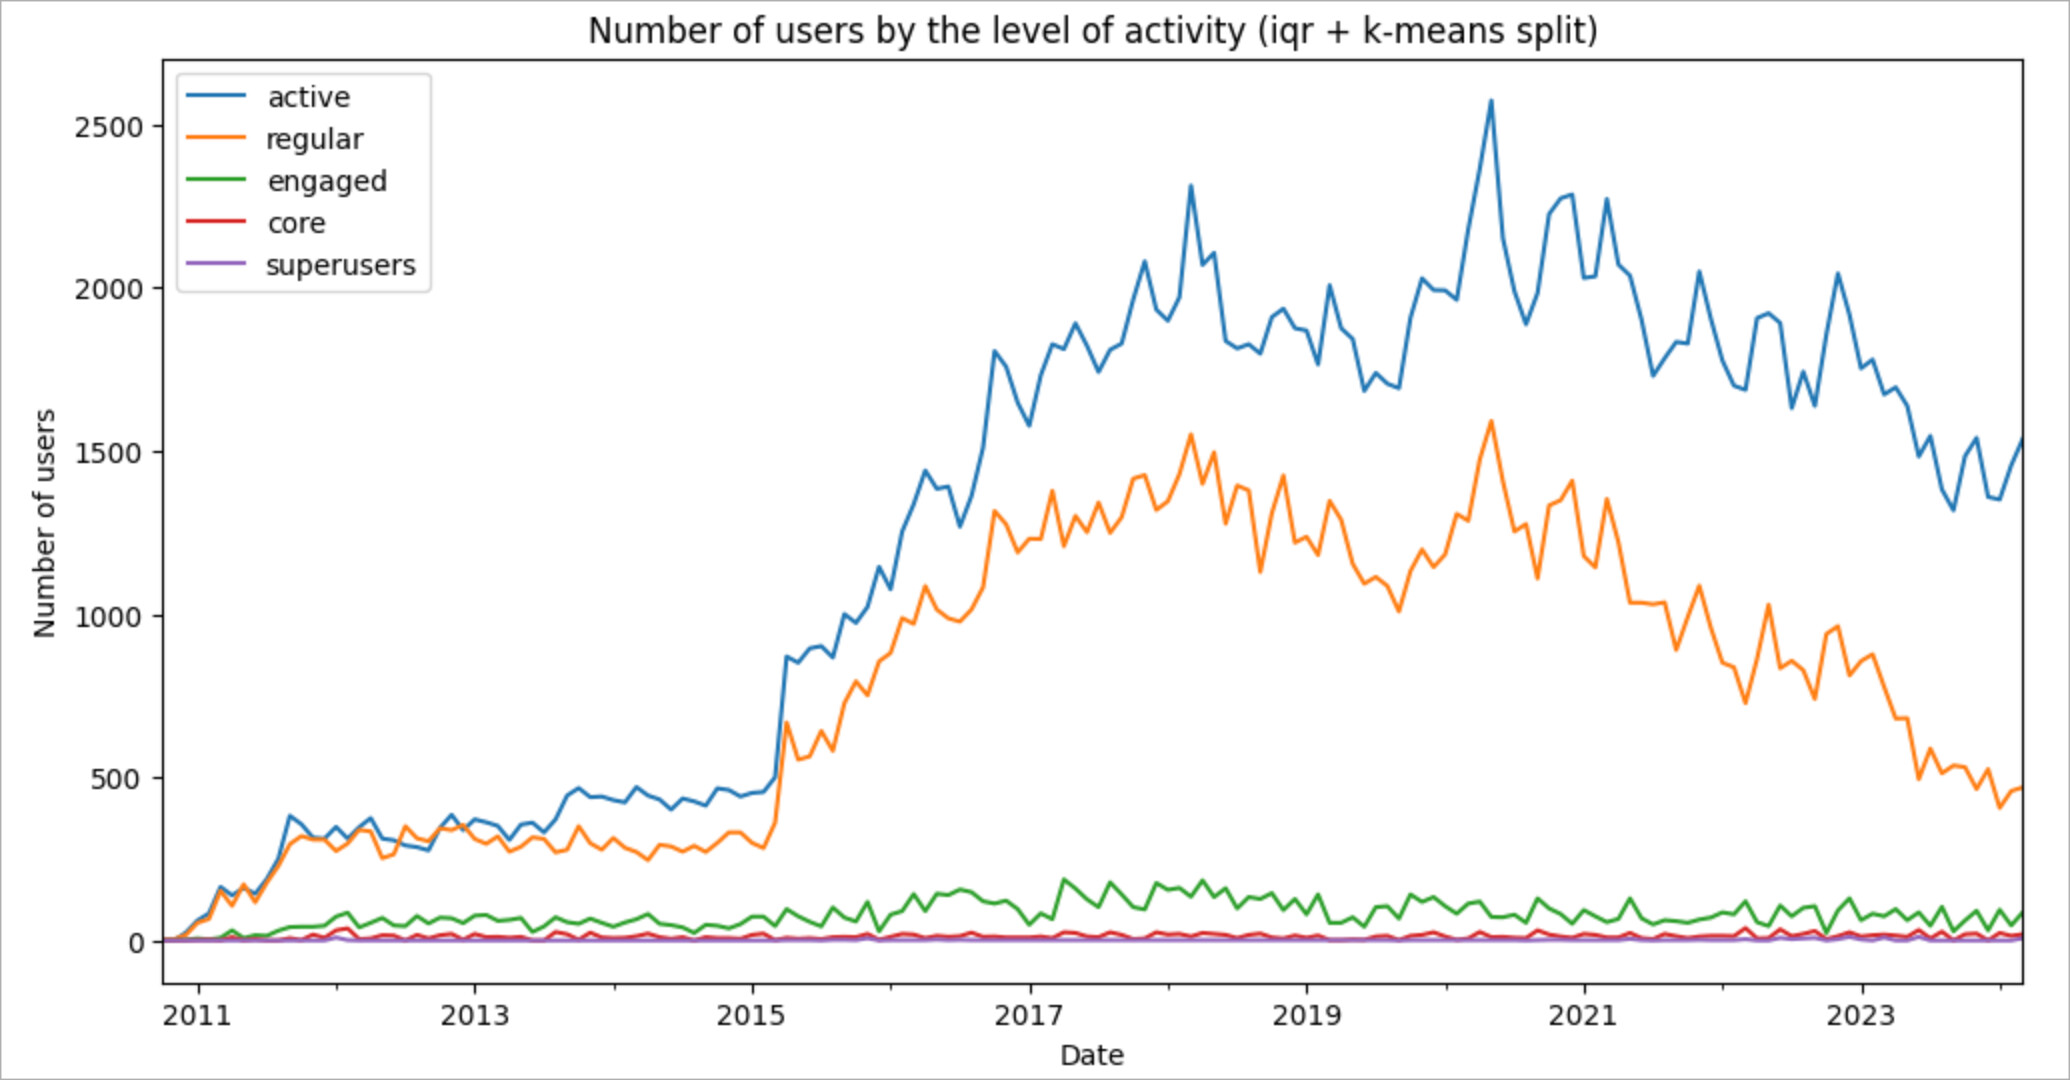
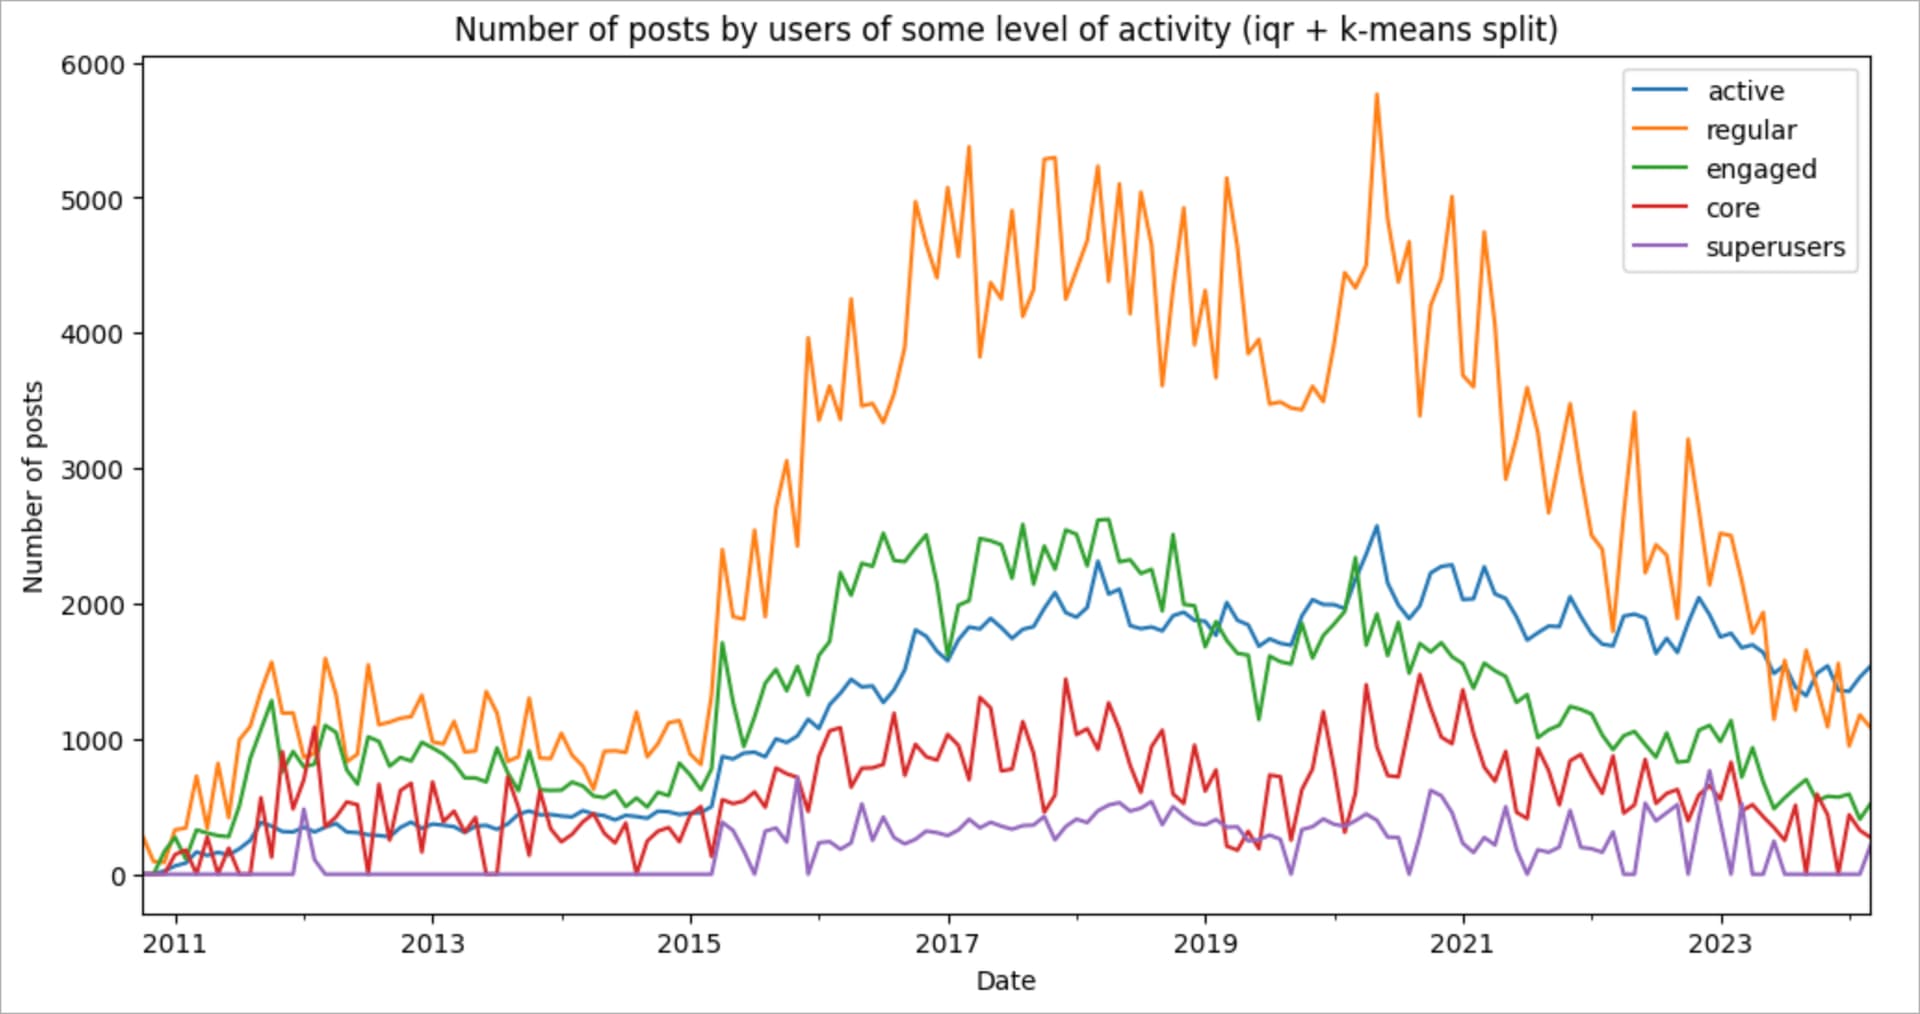
Also, we can look at the split for a random month to see how k-means separates the users.
So, here is the final numbers:
- Active users. 1 post.
- Regular users. 2- 8 posts.
- Engaged users. 8 - 34 posts.
- Core users. 19 - 104 posts.
- Super users. 50 or more posts.
This split is very close to what we expected to see, and it has no manual steps, plus it is adaptive to any community size. Nice!
As we can see, the boundaries have a large overlap. This is precisely because the splitting algorithm adapts to the community size (so we have different numbers for periods when the community has different sizes). Therefore, it is important to look at boundaries from the perspective of the age of a community. Good news is that you can do this in the app! Here are the links to the metric values:
- Upper bound of the regular user cohort
- Lower bound of the engaged user cohort and upper bound of the engaged user cohort
- Lower core user cohort bound and upper core user cohort bound
- Lower super user cohort bound
If accuracy is not critical for you at the current point of time, you can safely use expert opinion values from the section above. Otherwise, I am glad to see you in the app! =)
Note: If you are planning to use the expert opinion bounds from this research, please note that for the Stack Overflow engine posts and discussions are almost the same thing, which means that you need to multiply the provided bounds by an approximate multiplier of 2.5 if you want to set bounds based on the number of posts.
Question for you: How do you segment your users by engagement level? I’d love to hear your thoughts and comments!