You’ve probably heard the phrase “90-9-1.” If not, let me fill you in. In 2006, American usability expert Jakob Nielsen described his observations about unequal participation in online communities. He argued that in a typical healthy community, 90% of people are passive, 9% are active only occasionally, and just 1%, the core of the community, create the majority of activity.
In today’s article, we’ll find out what the 90-9-1 rule looks like in practice. As always, all the credit for the technical side of the research goes to Pavel Klykov.
For our study, we used data from 157 public communities, representing a combined 301 months of activity from 3,081,682 users.
To make the research more practically useful and easier to follow, we’ll also look at how the 90-9-1 rule correlates with the breakdown of participants into engagement cohorts, which I covered earlier.
So let’s dive in!
How much content does each group create?
If we look at all users, in theory we should see that 90% of users never wrote anything, 9% wrote a little, and 1% of users are the authors of the majority of messages in the community.
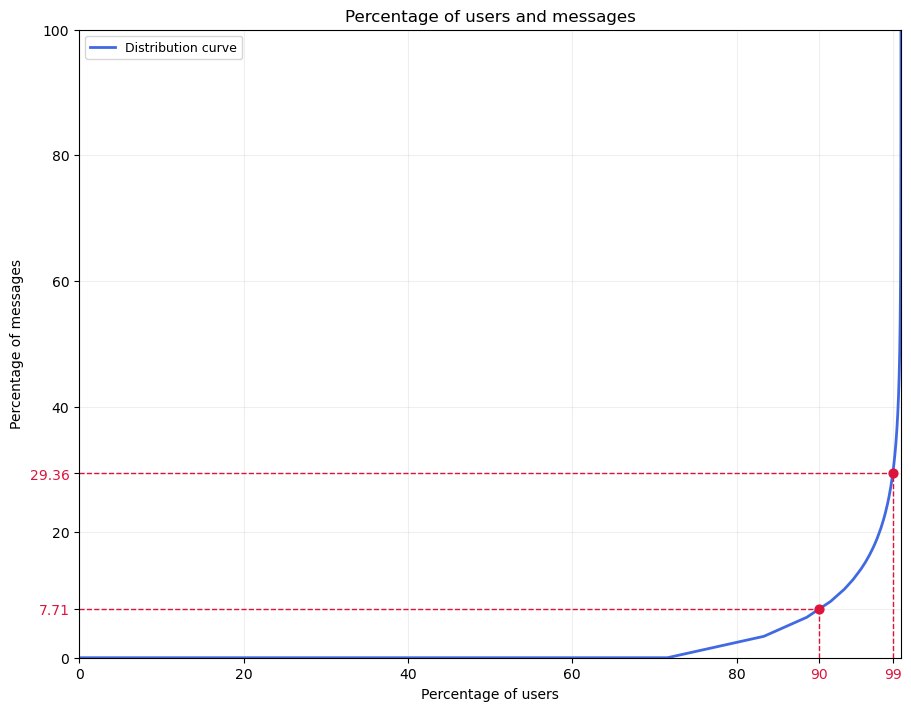
In our dataset, we found that the “90% of the least active people,” including those who never wrote anything, created about 8% of the content in their communities. Meanwhile, the “9%” of casual users created 22% of the content. The remaining 70% of content in the communities we studied was created by the top 1% of users.
What do engagement cohorts look like in our data?
The 90-9-1 rule gives us a useful abstraction. At the same time, if we want to see the real distribution of users by engagement, we need to break them into cohorts.
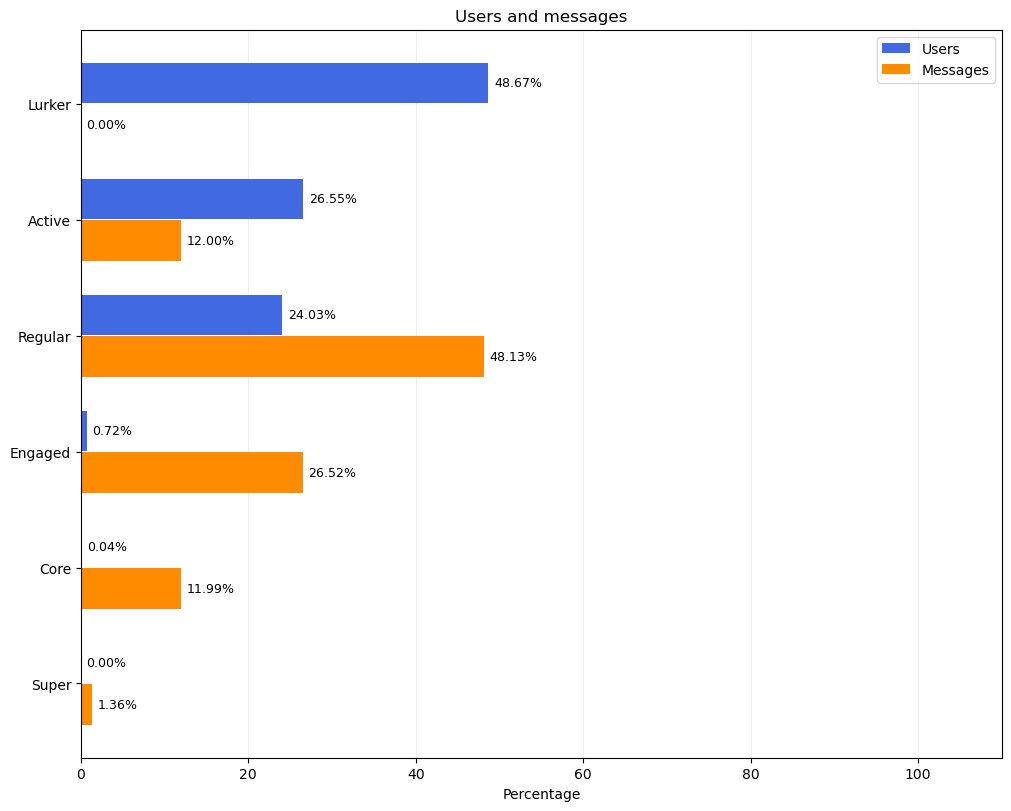
The cohorts in the chart above were calculated for each community in the dataset: the more messages a user wrote, the higher their engagement level. We then aggregated the data across all communities and looked at the percentage of users in each cohort and the number of messages written by those users. For lurkers, we only counted those who didn’t create a single message in a community.
As we can see, 0.04% of super and core users create as much as 26% of active users do.
How does the 90-9-1 rule align with engagement cohorts?
To wrap up, let’s put it all together on one chart.
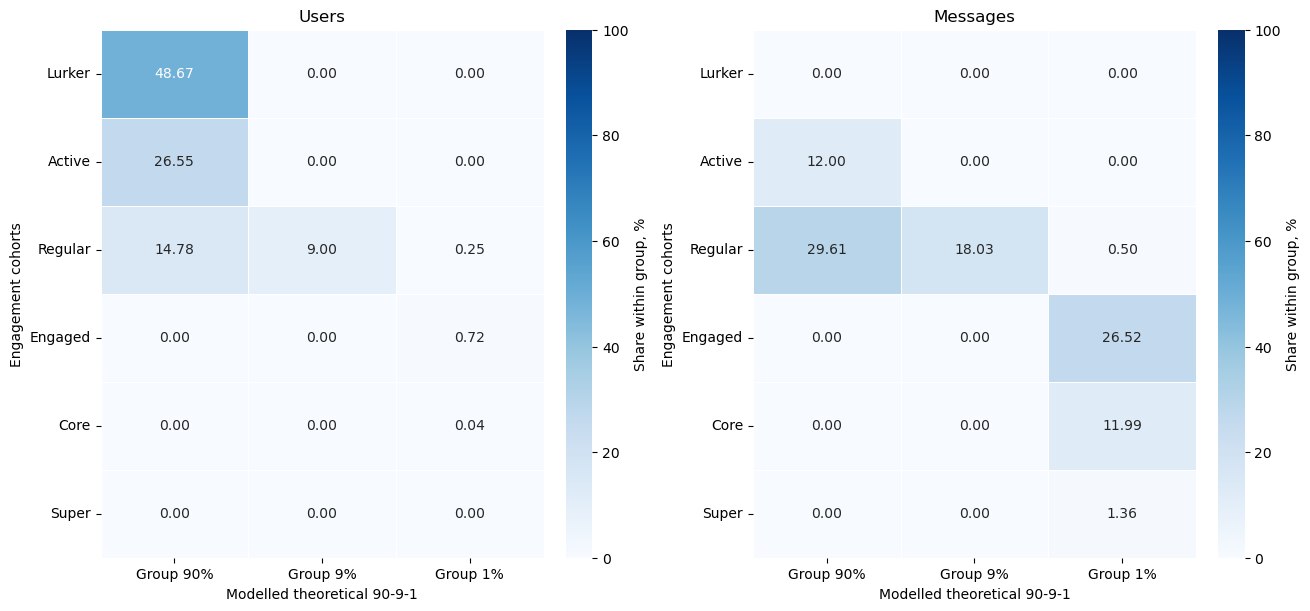
As you can see, the two groups of users generating the most messages are regular users from the 90% group and engaged users from the 1% group followed by regular users from 9% and the core users. If you are currently thinking what group to focus on to boost the engagement, those are perfect candidates.
What does this mean in practice?
As we’ve seen today, the theoretical 90-9-1 rule is very close to what we see in the data, but it has a “heavier tail.” Cohorts allow us to describe users by engagement level in more detail and closely mirror the 90-9-1 distribution.
And finally, please do not forget to love your super users! This small group of people is the heart of your community. And if you want to make this group bigger and better in some ways, we’d love to help!